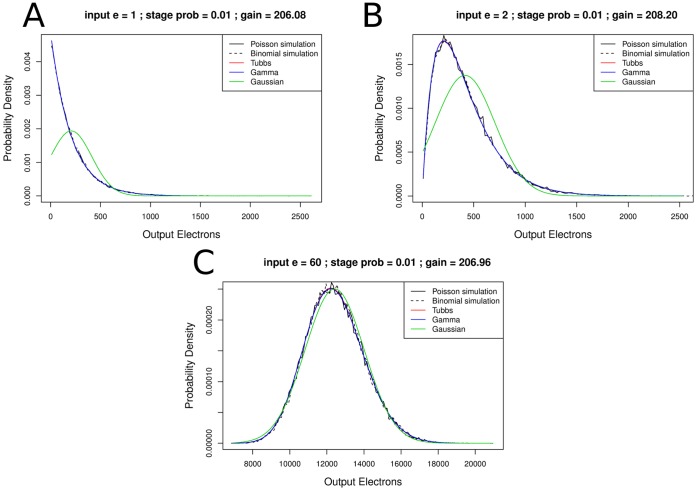
Figure 4. Simulation of the EM register composed of 536 stages with the Tubbs model, gamma distribution and normal distributions fitted.
The parameters for the distributions were calculated from the Poisson distribution (50,000 samples). Gain is estimated as sample mean divided by the number of input electrons, the parameters for the normal distribution are sample mean and sample standard deviation. (A) 1 input electron, (B) 2 input electrons, (C) 60 input electrons. The probability to create a new electron for each existing electron per multiplication stage is 1%. That yielded overall gains between 206 and 208. Both simulations, the Tubbs model and the gamma distribution are very similar in all cases. For a high number of input electrons, the similarity of the normal distribution to the simulated data is also high. However, EMCCDs are used to measure low intensities or single photons.

