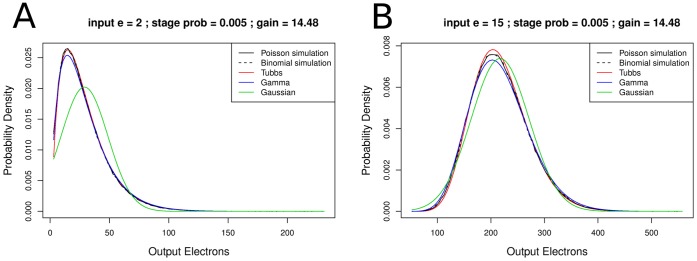
Figure 5. Difference of the Tubbs model and the gamma distribution for low gain settings.

The EM register models are fitted to simulated data (A) 2 input electrons, (B) 15 input electrons. The probability to create a new electron per existing electron in a multiplication bin is 0.5%. That yielded an overall gain of 14.48. Sample number 250,000. For two input electrons the Tubbs model fits the data slightly better than the gamma distribution. However, EMCCDs are usually operated with much higher EM gain values.
