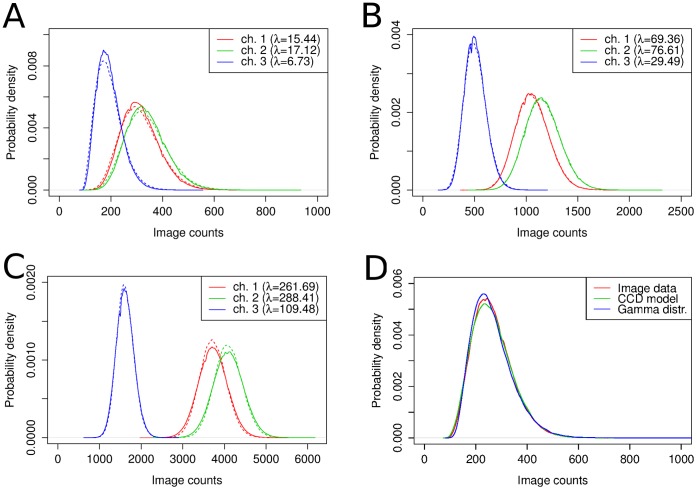
Figure 10. Comparison of the density of stacks of white light images with the model density.
Each panel shows intensity density of a data set of 100 frames and 3 optical channels (continuous lines). The data sets were taken with different intensities; (A) low intensity, (B) medium intensity and (C) high intensity. The model densities are drawn with dashed lines. The common gain estimate is 175.9. The difference in intensities for different channels of the same data set is caused by the splitter optics. Panel (D) shows the comparison of the density of the image counts with the density of the CCD model and the density of a convolution of a gamma distribution with a normal distribution. The shape parameter of the gamma distribution is half the number of input electrons of the EM register, while the scale parameter is twice the estimated EM gain. The estimated number of average input electrons is 8.7. For higher light intensities, the densities become more similar.

