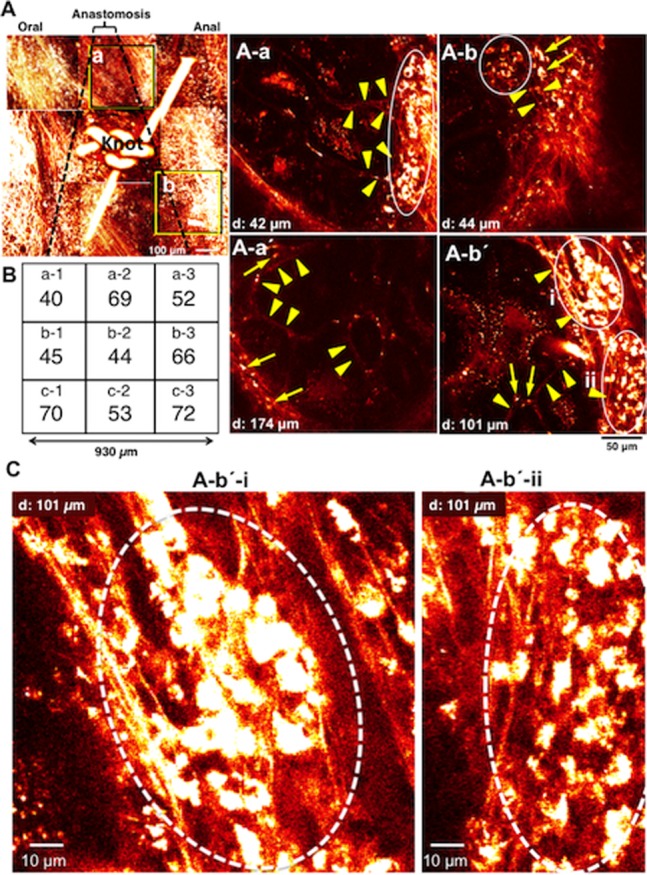
Figure 5. Images of anastomotic region of the terminal ileum in a MOS-treated mouse.

The dotted lines indicates the anastomosis site. Around the knot of thread we obtained each image from 9 visual fields. A. Images stacked with Z axis to a total depth of 200–300 µm. A–a. image 42 µm deep to the serosa surface in area (a) in A. A–a’. image 174 µm deep to the serosa surface in the same area (a) in A. A–b. 44 µm deep to the serosa surface in area (b) in A. A–b’. image 101 µm deep to the serosa surface in the same area (b) in A. Arrows indicate nerve cells in A–a’, b and b’, and arrowheads indicate nerve fibers in A–a, a’, b and b’, and circles indicate ganglion-like clusters of neurons in A–a, b and b’, respectively. B. Number of neurons in each field (size: 310 µm×310 µm) around the knot. C. Newborn nerve cells formed ganglion structures indicated by circles. These were enlarged from the images shown in A–b’–i and –ii.
