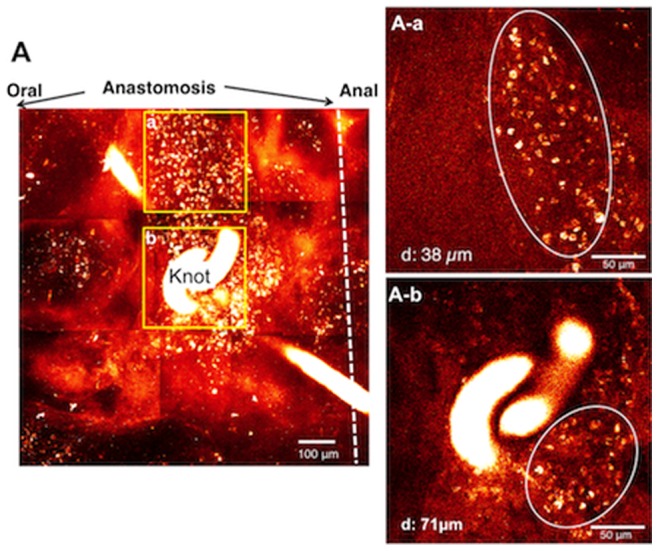
Figure 6. Images of anastomosis of the ileum in an SB-207266 (SB) plus MOS treated mouse.

SB plus MOS treatment was performed for one week. A. Images stacked in the Z axis with a total depth of 200 - 300 µm. A–a. image 38 µm deep to the serosa surface in area (a) in A. A–b. image 71 µm deep to the serosa surface in area (b) in A. Circles indicate aggregates of small non-neuronal cells (A–a and b), respectively.
