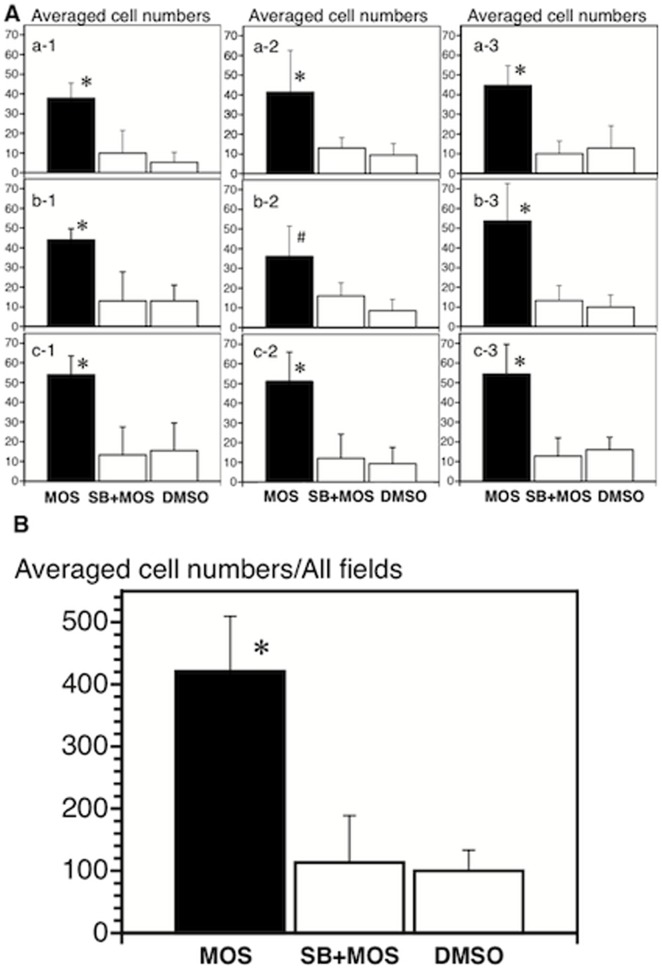
Figure 8. The average cell numbers in each of nine fields (A) and all fields (B) at the anastomosis.
The comparison was performed among MOS (n = 5), SB+MOS (n = 4) and vehicle-treated (n = 4) mice. Each of the nine fields corresponds to that in Figure 5B. *, P<0.05 vs. SB+MOS and vehicle. #, P<0.05 vs. vehicle.

