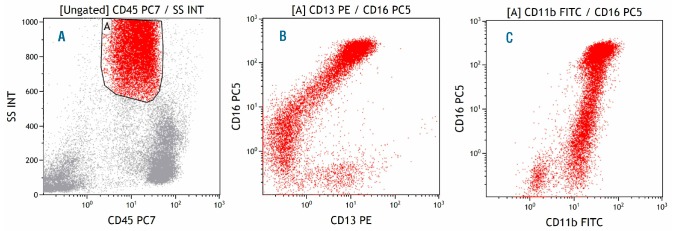
Figure 1.

Normal bone marrow, granulocytes. (A) Gate A identifies granulocytes in the CD45-SSC plot. (B) CD13 and CD16 expression in granulocytes following a C-shaped maturation pattern from CD13+CD16– to CD13–CD16+ and CD13+CD16++. (C) CD11b and CD16 expression in granulocytes following a giraffe-type maturation pattern from CD11b–CD16– to CD11b+CD16– and CD11b++CD16++.
