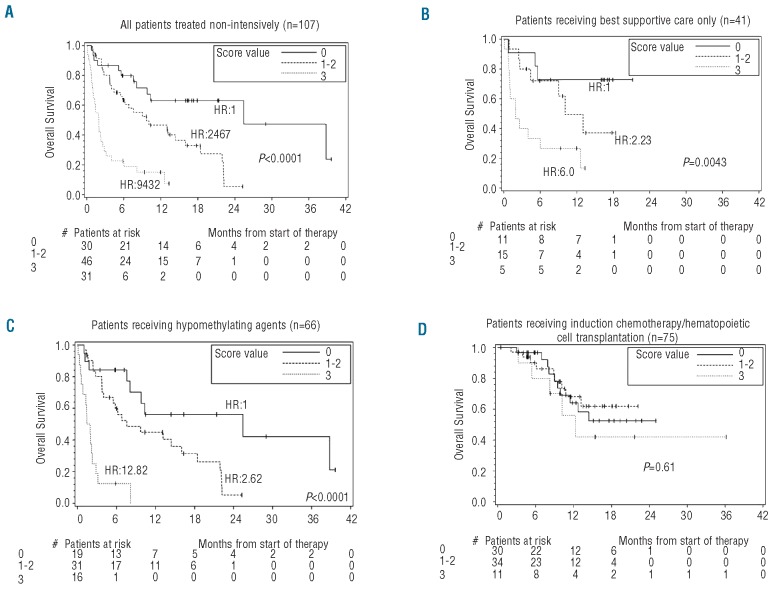
Figure 2.
Overall survival (OS) according to frailty score risk groups and treatment (evaluable patients) (A). All patients treated non-intensively (n=107). (B). Patients receiving best supportive care only (n=41). (C). Patients receiving hypomethylating agents (n=66). (D). Patients receiving induction chemotherapy/hematopoietic cell transplantation (n=75).

