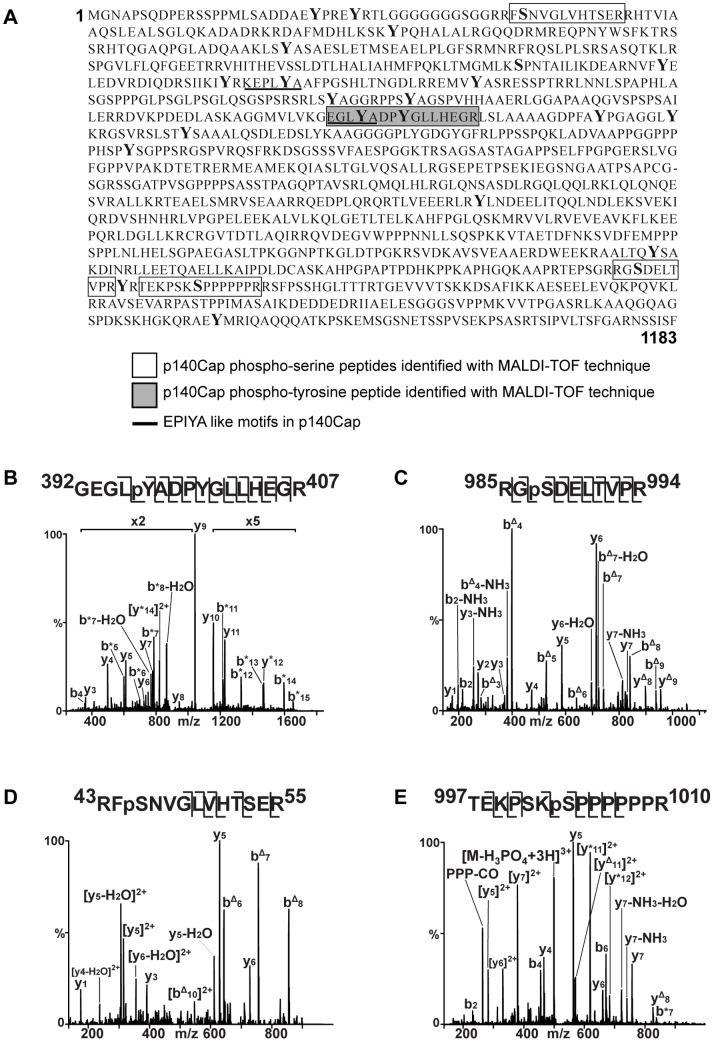
Figure 1. Amino acid sequence of p140Cap and spectra of in vivo phosphorylated peptides. A.
Amino acid sequence of p140Cap (NCBI Reference Sequence: NP_079524.2; REFSEQ: accession NM_025248.2) showing, the peptides found to be phosphorylated by MS analysis (phosphoserine: blank open box; phosphotyrosine: grey box) and the EPIYA-like motifs (underlined). All the tyrosine residues present in p140Cap are indicated in Bold. Note that the phosphoserines in position 45, 987 and 1003 are conserved among human and murine sequences. B. The phosphopeptide 392-GEGLpYADPYGLLHEGR-407 with m/z 913.9091 (z: +2) was sequenced by LC-MS2. The signals of ions within 350–1030 and 1100–1685 m/z were enhanced of 2 and 5 times, respectively. The signal enhancement facilitated the labeling of the ions. Only the most relevant fragment ion signals are labeled in the MS2 spectrum. *, Ions containing phosphorylated tyrosine-396 (pY396). C. MS3 spectrum of the phosphopeptide 985-RGpSDELTVPR-994. In MS2 mode the parent ion at m/z 605.2843 Th (z: 2+) lost phosphoric acid generating an ion at m/z 556.2868 Th, which was subjected to MS3 fragmentation. Delta indicates the loss of phosphoric acid. D. MS3 spectrum of the peptide 43-RFpSNVGLVHTSER-55. E. MS2 spectrum of 997-TEKPSKpSPPPPPPR-1010. *, Ions containing phosphorylated serine-1003 (pS1003). PPP-CO indicates an internal fragment ion containing three proline residues which has lost carbon monoxide (28 Da).

