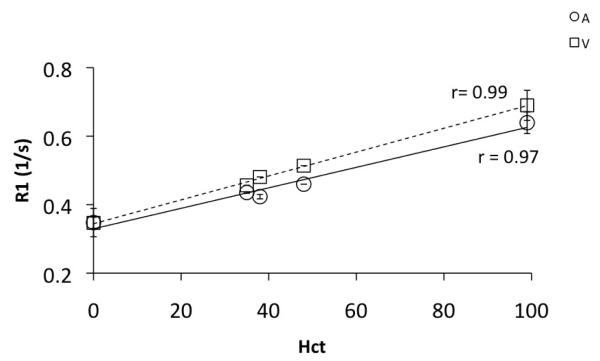
Figure 3.
Relaxivity (1/T1) of arterial (A, R1a) and venous (V, R1v) blood as a function of hematocrit concentration. Relaxivity increases (T1 decreases) as Hct increases linearly in both arterial and venous blood. This study, Hct: 0 – 100, R1a(7T) = 0.34(Hct) + 0.34, R1v(7T)=0.29(Hct) + 0.33, @3T(8) Hct: 32 – 48, R1a(3T) = 0.8Hct + 0.28, R1v(3T)=0.5(Hct) + 0.38

