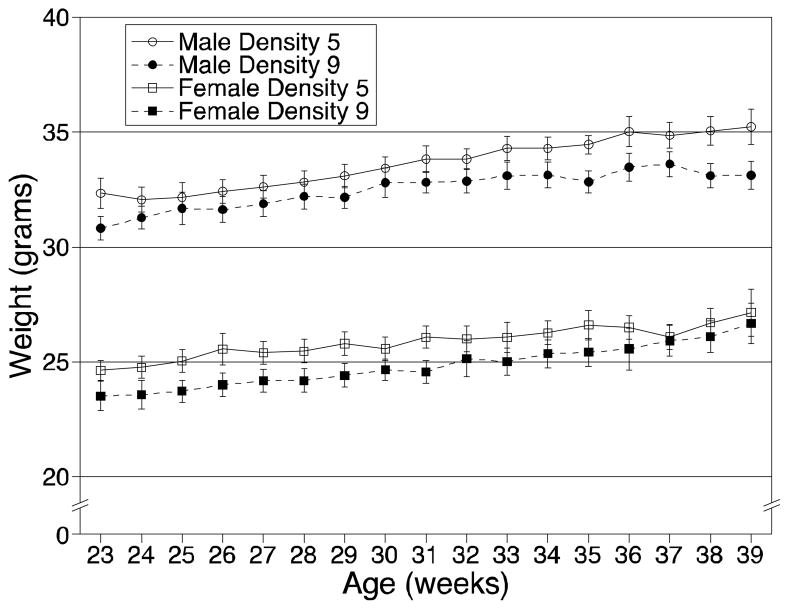
Figure 3.
Growth curves of mice housed at 5 (D5) and 9 (D9) mice/pen. Open symbols and solid lines are mice housed at D5; closed symbols and dotted lines are mice housed at D9. Squares are females and circles are males. Each symbol represents the average of 6 pens/group ± standard error of mean (SEM).

