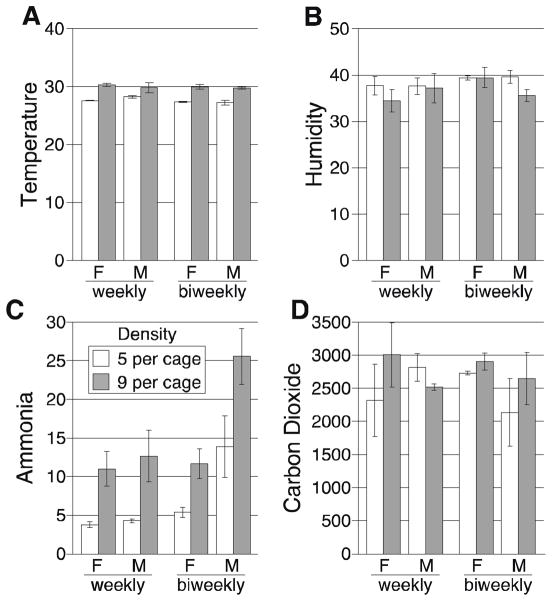
Figure 4.
Air quality within pens as a function of housing density and frequency of cage changing. (A) Temperature; (B) humidity; (C) ammonia; (D) carbon dioxide. For females (F) and males (M), each bar is the mean and SEM of 3 pens/group. Each pen was measured at 8 different times, so each bar represents the mean of 24 measurements. Open bars are 5 mice/pen (D5); closed bars are 9 mice/pen (D9). Bedding was changed weekly or every 2 weeks as shown, and air was measured on the day prior to change (day 6 or 13).

