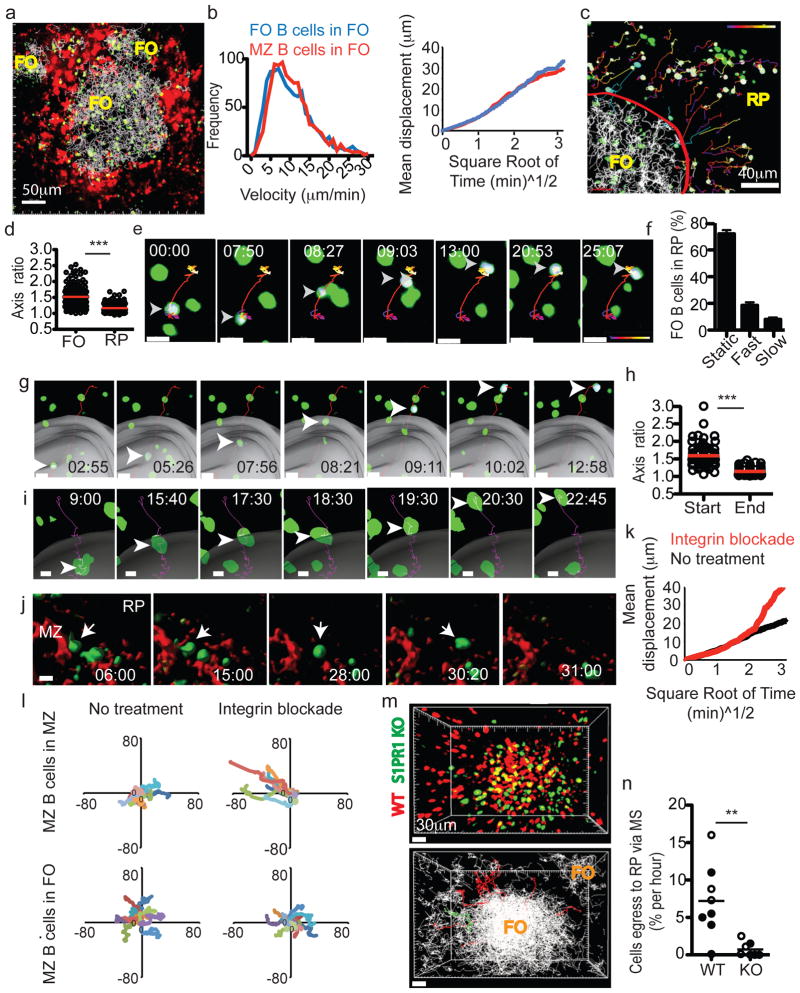
Figure 4. Splenic FO B cell migration and S1PR1 requirement for exit.
(a) 54μm z-projection view showing transferred FO B cells (green) and their tracks (white lines) and PE-IC-labeled macrophages (red). (b) Instantaneous velocities (left) and displacement versus square root of time (right) of FO and MZ B cells in the FO. Data from at 5–6 experiments (3–4 mice). (c) 45μm z-projection view of FO B cells (green) in FO and red pulp (RP). Red line, MZ-FO border; white lines, tracks of FO B cells in FO; time-coded colored lines, FO B cells in RP; blue lines, FO B cells in transition from FO to MZ. Cells tracked outside the FO are highlighted with a white surface. (d) Axis ratio of FO B cells in FO and RP. (e) FO B cell movement in the RP. (f) Percentage of cells in RP exhibiting stationary (‘Static’), rapid (‘Fast’) or migratory (‘Slow’) behavior (5 experiments in 3 mice, n= 550 cells). (g) FO B cell crossing from FO to MZ. Grey surface, MZ–FO interface. (h) Axis ratio of FO B cells migrating from FO to MZ at start and end of track (n= 24 cells). (i–l) Intravital TPLSM of MZ B cells following integrin blockade. (i) MZ B cell crossing from FO to MZ. (j) MZ B cell movement from MZ to RP. (k) Displacement versus square root of time (right) of MZ B cells in the MZ before (black) and two hours after (red) integrin blockade. (l) Superimposed 10-min tracks of randomly selected MZ B cells, in the x–y plane. Units are in micrometers. Data for I–L were from 8 experiments (3 mice). (m) Upper, 90μm z-projection view of WT (red) and S1PR1 KO (green) FO B cells in spleen. Lower, automated tracks of transferred B cells (white). Tracks of WT cells (11 red lines) and KO cells (1 green line) leaving FO are shown. (n) FO egress rate of WT and S1PR1 KO B cells. Open circles, MZ–FO interface determined based on PE-IC labeling; filled circles, interface determined based on FO B cell tracks. In e, g, I, j, elapsed time is in min:sec, arrowheads point to tracked cells and scale bar indicates 10μm. In f, h, n, bars or lines represent mean (error bars in f, ±SEM).

