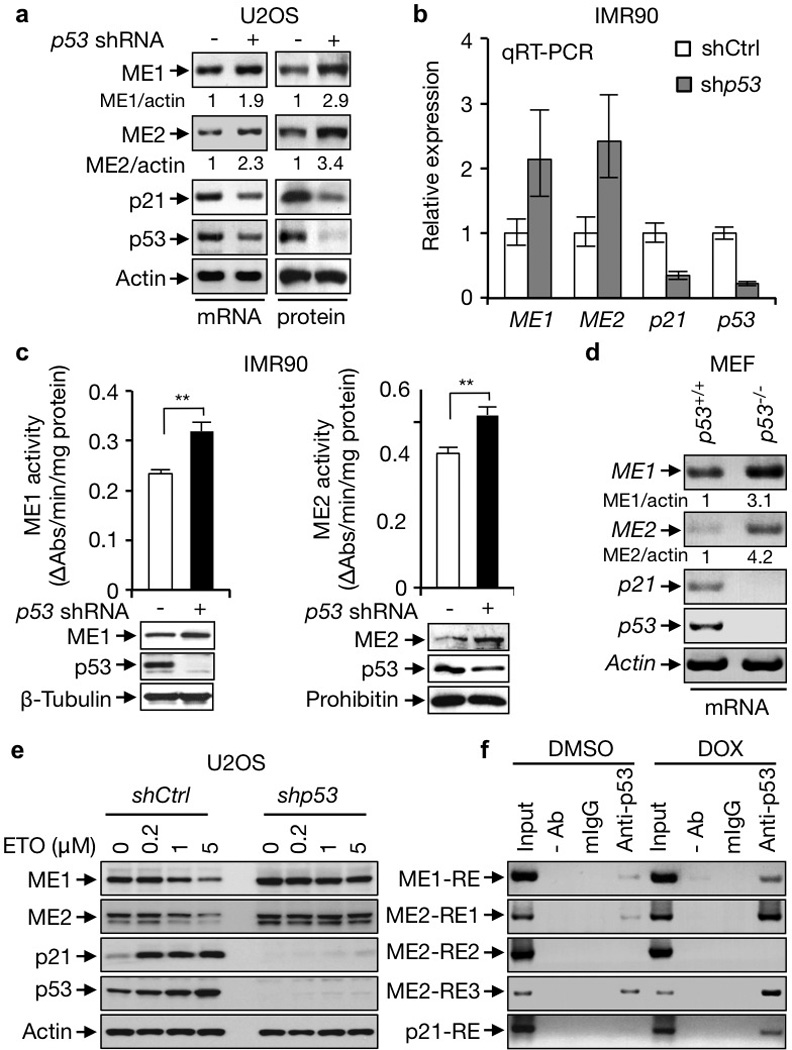
Figure 1. p53 represses the expression of MEs.

a, ME mRNA and protein expression in U2OS cells stably expressing p53 shRNA or control shRNA. Relative ME/actin ratios are given. b, c, mRNA expression (b), total activity, and protein levels (c) of MEs in p53-depleted and control IMR90 cells. Data shown are mean ± SD, n=3. d, ME expression in p53+/+ and p53−/− MEFs. e, p53-depleted and control U2OS cells were treated with increasing amounts of ETO and assayed for ME expression. f, p53+/+ HCT116 cells treated with or without DOX (1 µg/ml) were subjected to ChIP assay with anti-p53 (DO-1), a control mouse IgG, or no antibody (−). *, p<0.05; **, p<0.01; ***, p<0.001.
