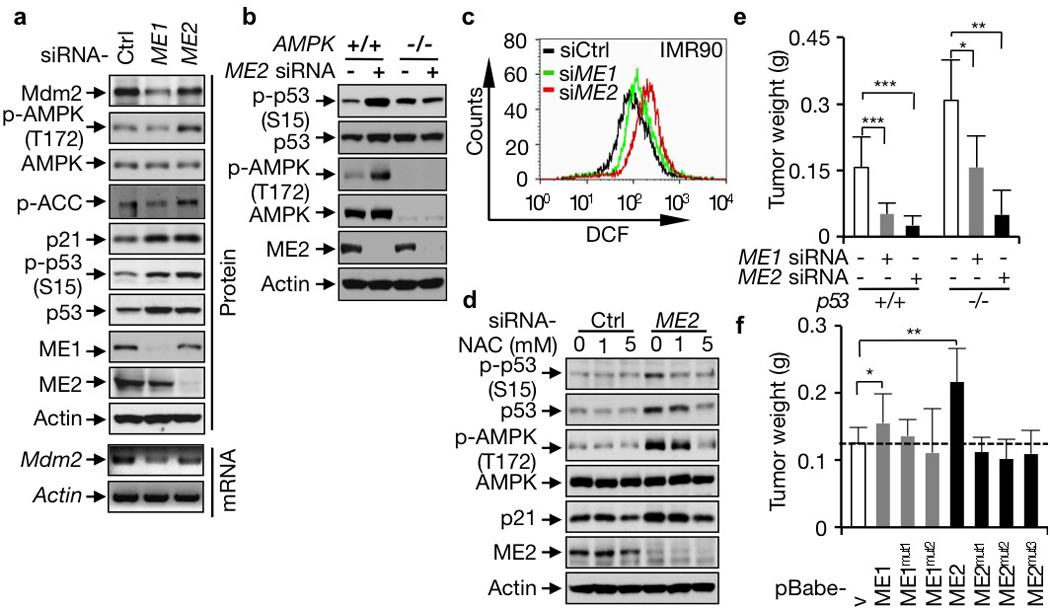
Figure 4. Mechanisms of p53 activation induced by ME down-regulation and a role of MEs in tumor growth.

a, Effect of ME1 and ME2 knockdown on p53 and AMPK activation and Mdm2 expression. ACC: Acetyl-CoA carboxylase. b, p53 and AMPK activation in AMPK+/+ and AMPK−/− MEF cells transfected with control or ME2 siRNA. c, ROS levels in IMR90 cells transfected with ME1, ME2, or control siRNA. d, Effect of NAC on AMPK and p53 activation in IMR90 cells transfected with control siRNA or ME2 siRNA. e, f, Average weights of xenograft tumors (mean ± SD, n=6) generated by p53+/+ and p53−/− HCT116 cells transfected with ME1, ME2, or control siRNA (e), or p53+/+ HCT116 cells stably over-expressing wild-type or mutant MEs (f).
