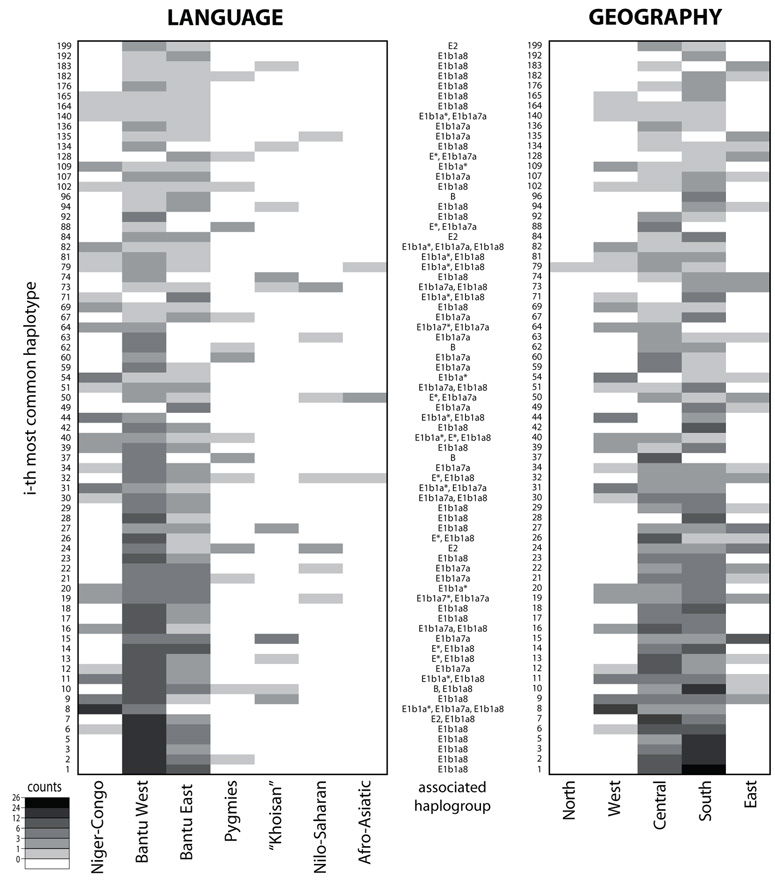
Fig. 4. Patterns of haplotype sharing.
Heat plots showing the count of the most common haplotypes from 11 STRs (DYS19, DYS389I, DYS389II, DYS390, DYS391, DYS392, DYS393, DYS437, DYS438, DYS439, and the sum of DYS385a/b) shared among at least three individual groups. Individual groups are combined into meta-groups according to their linguistic affiliation (left) and geographic location (right); the same heat plot, but for single groups, is reported in Supplementary fig. 5 (Supplementary Material online).

