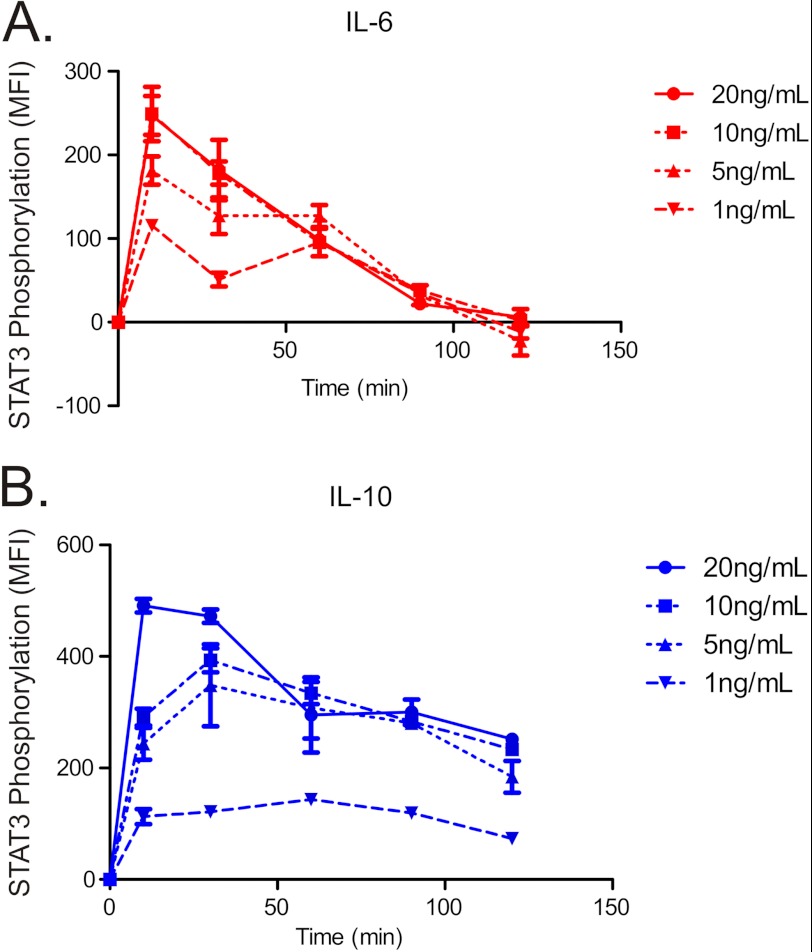
FIGURE 3.
Phosphorylation and of STAT3 in response to IL-6 or IL-10. A and B, time course of STAT3 tyrosine 705 phosphorylation in IL-6–treated (A) and IL-10–treated (B) DCs, measured by flow cytometry in response to cytokine concentrations of 1, 5, 10, and 20 ng/ml. MFI is median fluorescence intensity. Error bars are S.D. of MFI of three samples from the same blood donor.

