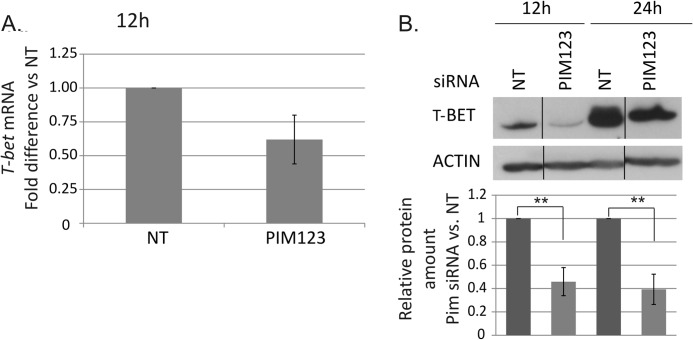
FIGURE 3.
Depletion of PIM kinases down-regulates T-BET at mRNA and protein levels. A, the levels of T-BET mRNA in the nucleofected cells were analyzed by TaqMan RT-PCR. The graph represents the average -fold differences ±S.E. (error bars) of T-BET mRNA in PIM siRNA-treated Th1 cells compared with NT siRNA-treated Th1 cells. The value of the control cells was set as 1. The data were calculated from five of six independent experiments. B, the bars represent the mean values ±S.E. (error bars) of the relative levels of T-BET protein between the control and PIM siRNA samples after normalization against the levels of β-actin. The values of the control samples were set as 1. The Western blots are representatives of these experiments. The data were calculated from six of seven independent experiments. Vertical lines represent repositioned gel lanes that are from the same blot and the same exposure. Statistical significances were calculated using the two-tailed paired t test: **, p < 0.02. siRNAs used were NT siRNA or PIM123 siRNAs.

