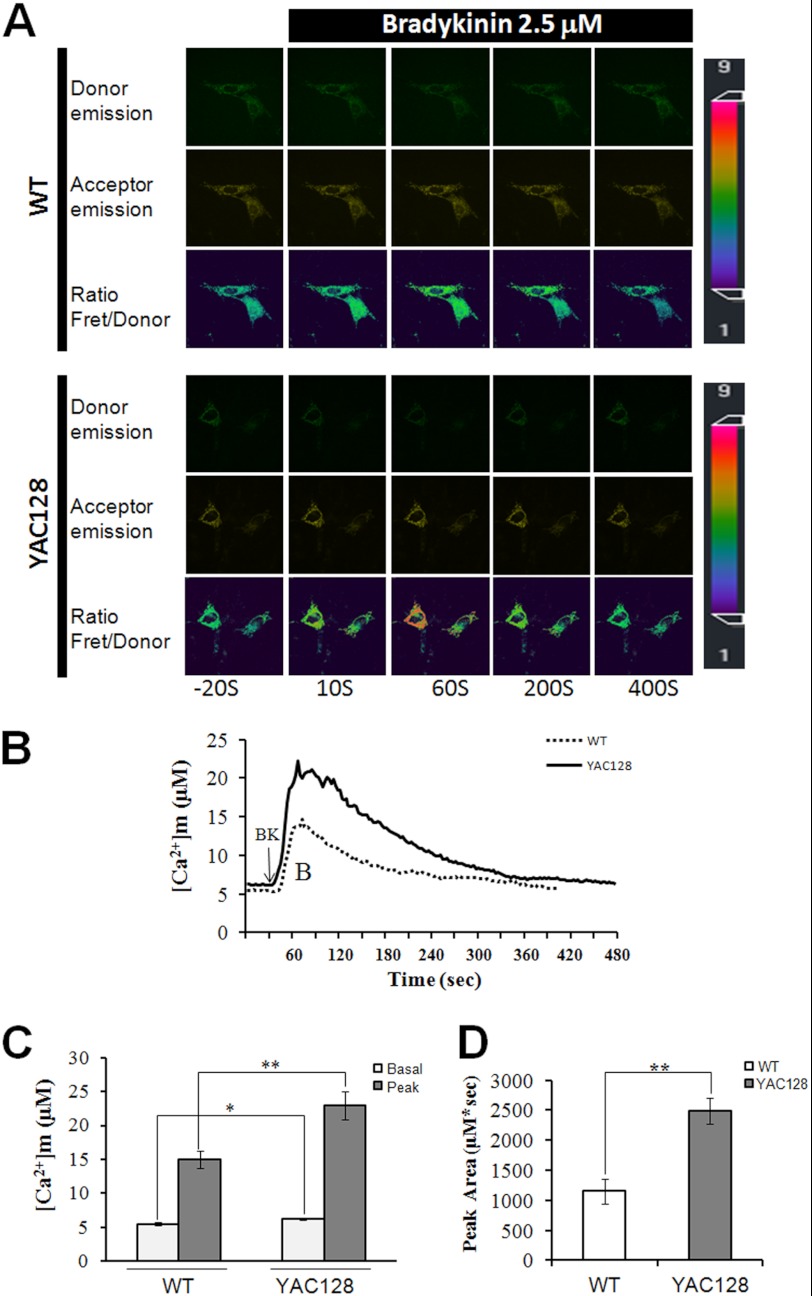
FIGURE 1.
Disrupted mitochondrial Ca2+ signaling in YAC128 MEFs. A, representative mitochondrial cameleon images showing donor, acceptor, and ratio (Fret/donor) in WT and YAC128 MEFs. The pseudocolor calibration scale bar for Fret/donor ratios is shown on the right. Ratio recordings are shown for 2.5 μm bradykinin-induced mitochondrial Ca2+ transients in MEFs. B, absolute mitochondrial Ca2+ concentration ([Ca2+]m) changes in response to BK (2.5 μm) in WT (n = 21) and YAC128 (n = 35) MEFs. C and D, significantly larger [Ca2+]m transients were found in YAC128 MEFs. Both basal and peak values (C) and peak areas (D) were significantly higher in YAC128 mitochondria than in WT mitochondria in response to BK (*, p < 0.05; **, p < 0.01). [Ca2+]m traces in B are shown as an average of all cells in one experiment. Similar results were obtained in three independent experiments. Data are shown as the mean ± S.E.

