
FIGURE 5.
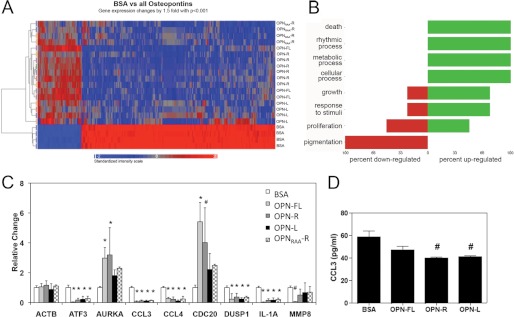
OPN binding altered gene expression in U-87 MG cells. A, heat map showing clustering of genes changed by >1.5-fold with p < 0.005 when U-87 MG cells bound to BSA were compared with U-87 MG cells bound to all OPNs determined by ANOVA. Both samples (y axis) and genes (x axis) were allowed to cluster unsupervised. The color scale of the log2 ratios is shown at the bottom. B, Gene Ontology classification. C, mRNA for nine genes shown were checked by quantitative PCR to validate the data from the microarray. The data were normalized to the levels of GAPDH and expressed as mean ± S.D. of relative gene expression to BSA. #, p < 0.05; *, p < 0.01 compared with BSA by paired Student's t test. D, determination of CCL3 protein level in 2 day-conditioned medium from U-87-MG cells bound to BSA and OPN by ELISA. #, p < 0.05 compared with BSA by paired Student's t test.