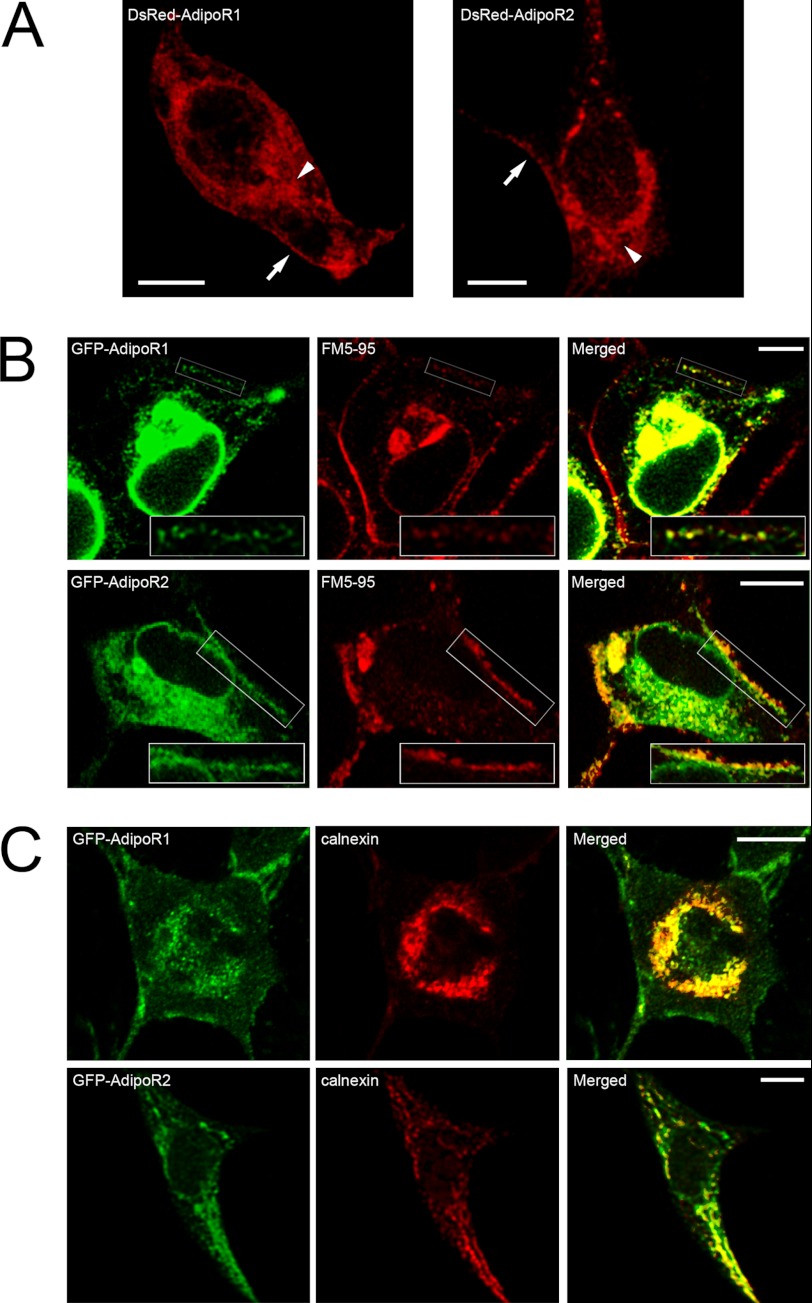
FIGURE 1.
Intracellular localization of fluorescently tagged AdipoR1 and AdipoR2 in HEK293AD cells. A, representative confocal images of HEK293AD cells expressing DsRed-AdipoR1 (left panel) or DsRed-AdipoR2 (right panel) are shown. AdipoR1 and AdipoR2 fluorescent signals accumulate in close apposition to the plasma membrane (arrows) as well as in an intracellular compartment surrounding the nucleus (arrowheads). B, shown is colocalization of GFP-AdipoR1 or GFP-AdipoR2 (green) with the plasma membrane marker FM5–95 (red). As shown in the rightmost panels, both AdipoR1 and AdipoR2 signals exhibit significant overlapping with FM5–95 at the plasma membrane. C, shown is colocalization analysis of GFP-tagged AdipoR1 and AdipoR2 (green) with the ER marker calnexin (red). Intracellular accumulation of AdipoR1 and AdipoR2 strongly coincides with calnexin immunosignal. Scale bars, 5 μm.

