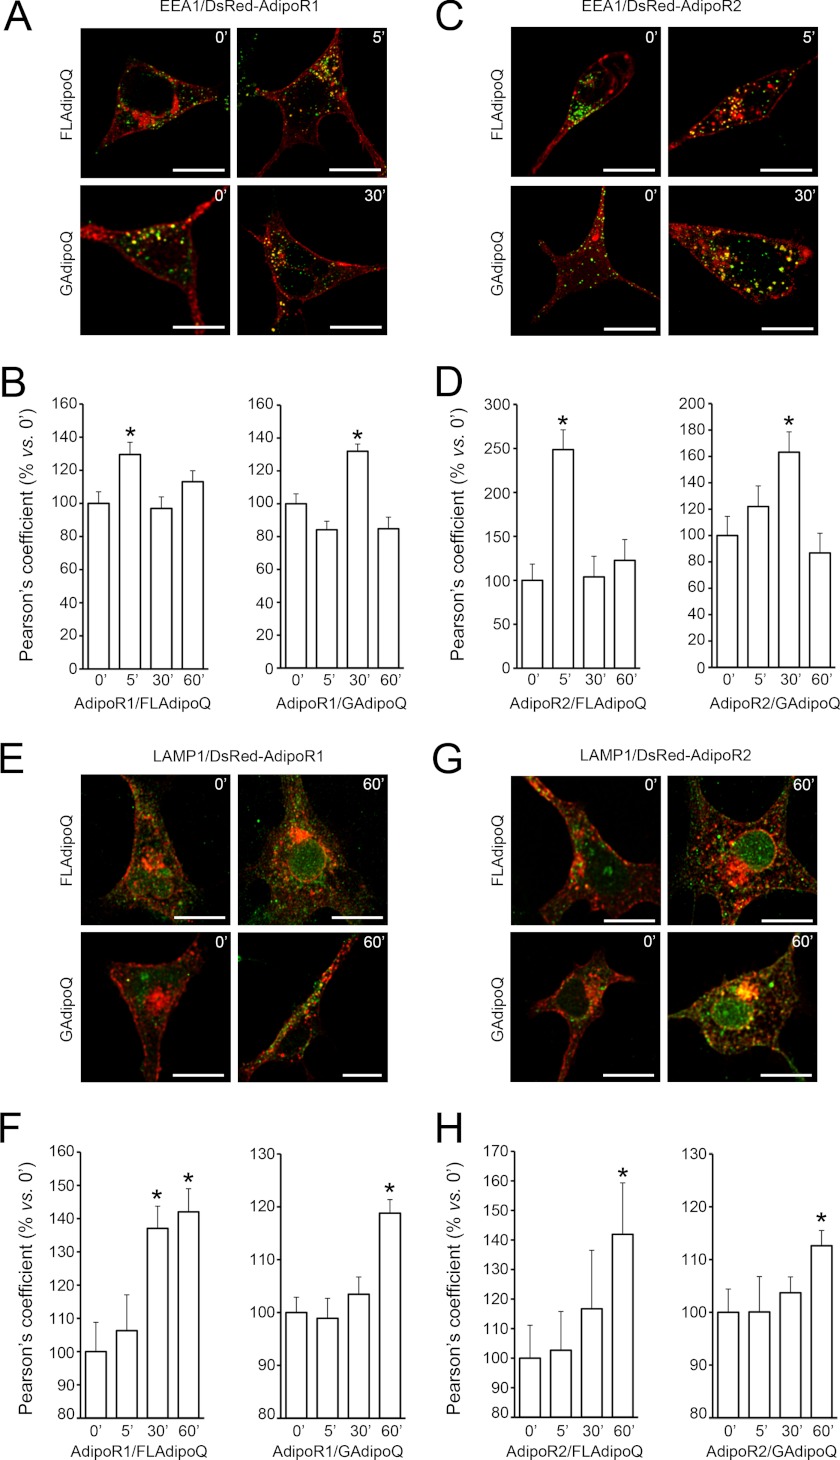
FIGURE 5.
AdipoR1 and AdipoR2 internalization dynamics in response to adiponectin. A and C, shown are representative confocal images of HEK293AD cells expressing DsRed-AdipoR1 (A) or DsRed-AdipoR2 (C) and treated with 100 nm FLAdipoQ (left panels) or 100 nm GAdipoQ (right panels) for 0, 5, 30, and 60 min. After treatment, cells were fixed and immunostained against the early endosome marker EEA1 (green). B and D, shown is quantification of the colocalization index (Pearson's coefficient) between DsRed-AdipoR1 or DsRed-AdipoR2 and EEA1 immunofluorescent signal in FLAdipoQ (left graphs)- or GAdipoQ-treated cells (right graphs). E and G, representative confocal images of HEK293AD cells expressing DsRed-AdipoR1 (E) or DsRed-AdipoR2 (G) treated with 100 nm FLAdipoQ (left panels) or 100 nm GAdipoQ (right panels) for 0, 5, 30, and 60 min and immunostained against LAMP1 (green). F and H, shown is the colocalization index between DsRed-AdipoR1 or DsRed-AdipoR2 and LAMP1 in FLAdipoQ (left graph)- or GAdipoQ-treated cells (right graph). Data are represented as the average ± S.E. from at least 12 cells per group collected from three independent experiments. *, p < 0.05 versus untreated cells.

