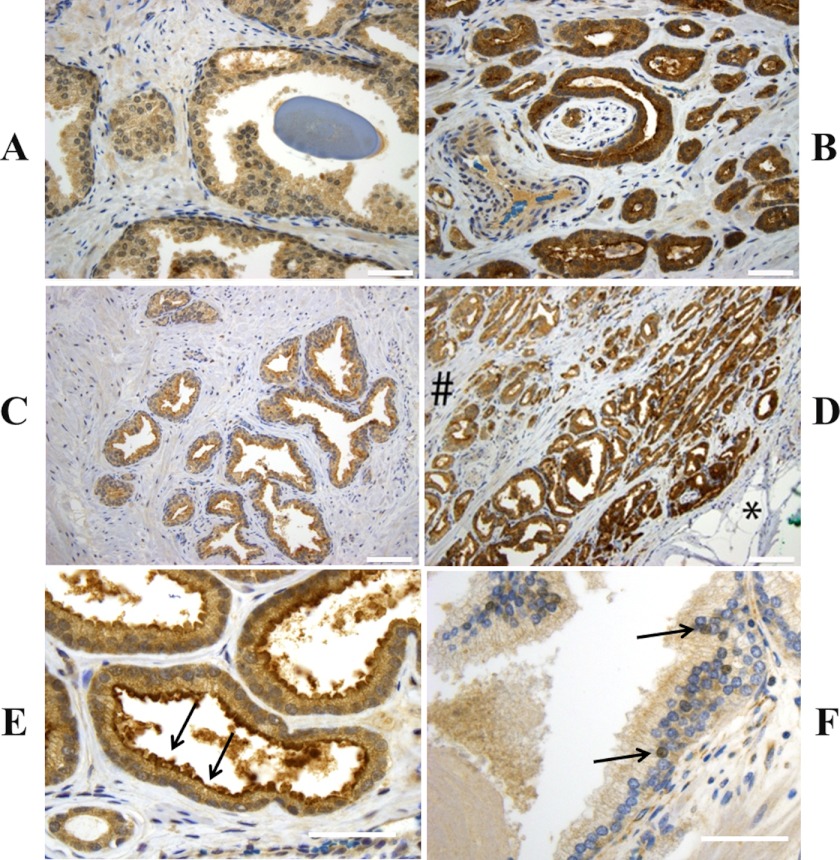
FIGURE 1.
sAC protein expression is elevated in prostate cancer. Shown are representative images of immunohistochemical staining for sAC (brown) combined with hematoxylin staining (blue). The majority of benign prostatic glands showed weak staining for sAC (A), whereas the majority of tumor glands showed moderate or strong staining for sAC (B). Benign glands near the prostatic capsule (right side of C) typically did not show increased staining compared with glands deeper within the prostate (left side of C). However, increased staining for sAC at the “capsular” leading edge of the prostate cancer (right side of D, noted by the asterisk) was seen in the vast majority of cases. The number sign indicates the area closer to the center of the gland. Although all cells showed diffuse staining of the cytoplasm, some also showed accentuated staining at the apical/luminal border (prostate cancer; arrows in E) or nuclear staining (benign prostatic gland; arrows in F). Original magnifications were ×400 (A, B, E, and F) and ×200 (C and D). Scale bars = 50 μm (A, B, E, and F) and 100 μm (C and D).

