
FIGURE 2.
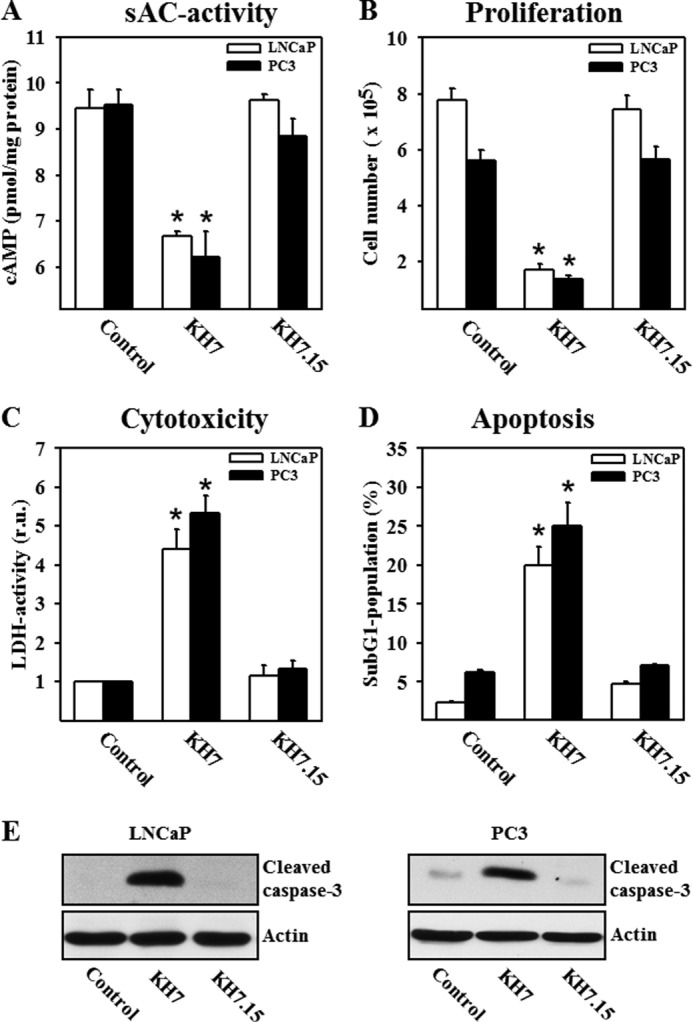
Inhibition of sAC reduces cellular cAMP content, inhibits proliferation, and leads to cytotoxicity and apoptosis in LNCaP and PC3 cells. Statistical analyses are presented of cellular cAMP content (A), cell number per dish (B), LDH activity in the cell culture medium (presented as a ratio to individual protein content; relative units (r.u.)) (C), and percentage of the sub-G1 population (D) in control cells and cells treated with the sAC inhibitor KH7 (20 μmol/liter) or its inactive analog KH7.15 (20 μmol/liter) for 48 h. Note that 150,000 cells per dish were plated at the beginning of all experiments. Values are the mean ± S.E. (n = 7–9). *, p < 0.05 versus the control. E, Western blot analysis of cleaved caspase-3 was performed with lysates of LNCaP and PC3 cells. Treatment conditions were similar to those described for A–D. The data are representative of five independent experiments with similar results.