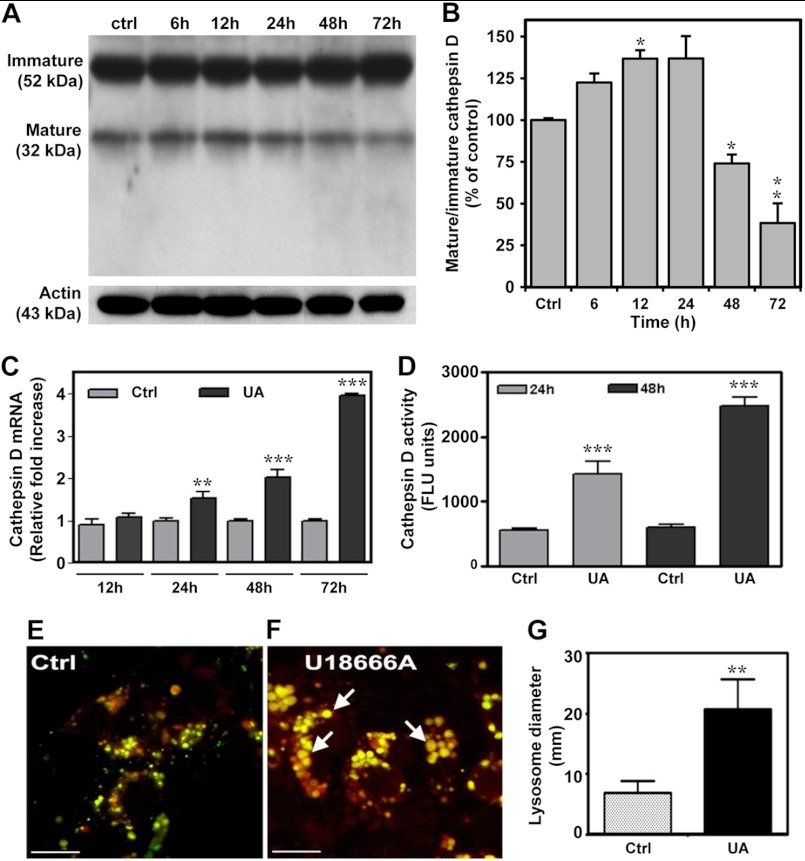
FIGURE 2.
Cathepsin D regulation in U18666A-treated neuronal cultures. A–D, cathepsin D immunoblot and quantification (A and B), mRNA levels (C), and enzyme activity (D) in hippocampal neuronal cultures treated with 5 μg/ml U18666A for different periods of time. These results showed a decrease in the ratio of mature to immature cathepsin D and increased activity and mRNA levels of cathepsin D compared with control cultures. E–G, photomicrographs (E and F) and the histogram (G) showing larger endosomal/lysosomal vesicles labeled with LysoSensor dye DND-160 in hippocampal neurons treated for 24 h with U18666A (F, arrows) compared with control cultures (E). UA, UA18666A; Ctrl, control. Scale bar, 40 μm. *, p < 0.05; **, p < 0.01; ***, p < 0.001. Error bars, S.E.

