FIGURE 3.
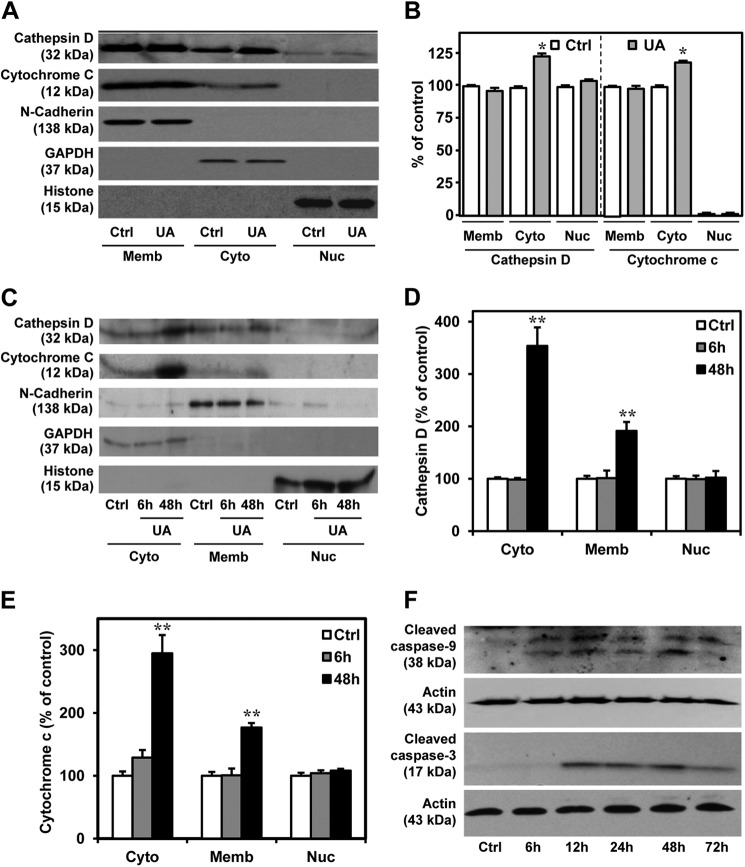
Cathepsin D, cytochrome c, and cleaved caspase-3 in U18666A-treated neuronal cultures. A and B, immunoblots (A) and quantification (B) depicting subcellular distribution of cathepsin D and cytochrome c and their relative alterations (B) in the mouse primary neurons treated with 5 μg/ml U18666A for 24 h. Note the higher cytosolic levels of cathepsin D and cytochrome c in the treated hippocampal neurons compared with controls. C–E, immunoblots (C) and quantification (D and E) depicting subcellular levels of cathepsin D and cytochrome c in the mouse primary neurons treated with 5 μg/ml U18666A for 6 and 48 h. Note the higher cytosolic levels of cathepsin D and cytochrome c at 48 h but not at 6 h following treatment with U18666A. F, immunoblots showing the relative increase in caspase-9 and cleaved caspase-3 levels following treatment with 5 μg/ml U18666A for 6–72 h. UA, UA18666A; Ctrl, control; Cyto, cytoplasmic; Memb, membrane; Nuc, nuclear. All results, which are presented as means ± S.E. (error bars), were obtained from three separate experiments. *, p < 0.05; **, p < 0.01.

