FIGURE 5.
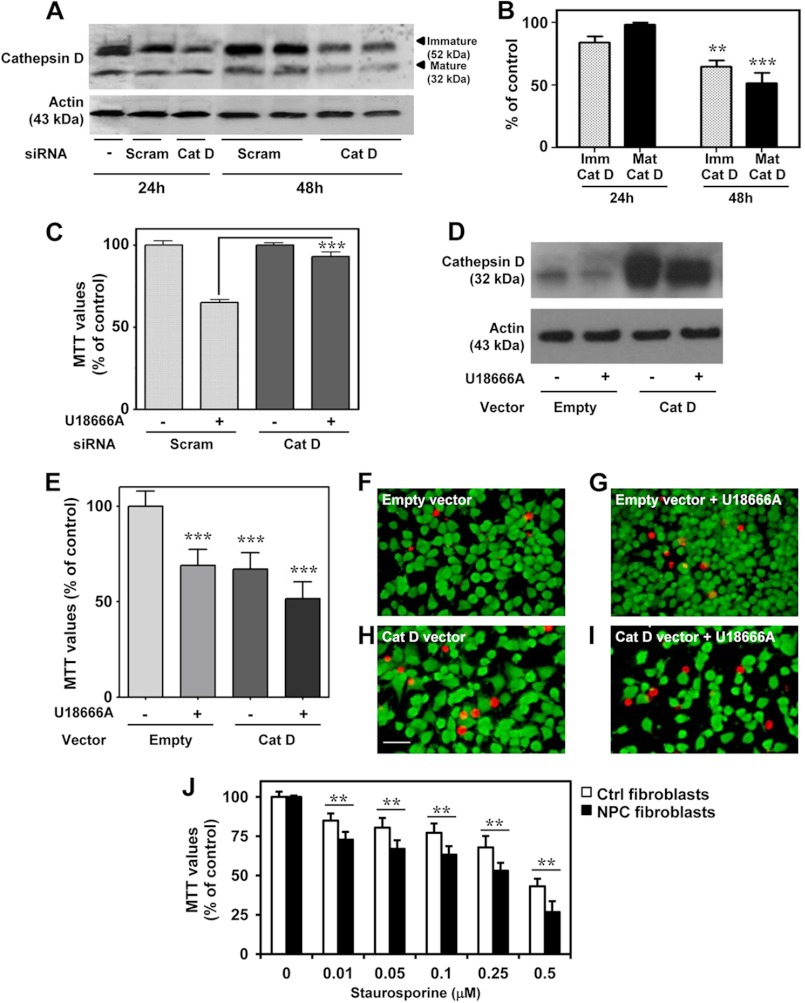
Cathepsin D and cell toxicity in cultured N2a and human fibroblasts cells. A and B, immunoblots (A) and quantifications (B) showing the decreased levels of both immature (Imm) and mature (Mat) cathepsin D after transfection of N2a cells with cathepsin D siRNA. C, cathepsin D siRNA prevents toxicity induced by 3 μg/ml U16888A in N2a cells compared with cells treated with scrambled siRNA, as detected using the MTT assay. D, immunoblot showing the increased cathepsin D levels after N2a cells were transiently transfected with a cathepsin D-expressing vector compared with an empty vector. E–I, enhanced cathepsin D levels following transfection increased cell death when treated with 3 μg/ml U18666A as evident by the MTT assay (E) and Live/Dead assay (F–I), which showed reduced cell density and increased EthD-1-labeled dead cells (red-colored cells). J, MTT assay showing fibroblasts from NPC patients were significantly more vulnerable to staurosporine-induced toxicity than normal control fibroblasts. All results, which are presented as means ± S.E. (error bars), were obtained from at least three separate experiments. Scale bar, 25 μm. Ctrl, control; Scram, scrambled siRNA. **, p < 0.01; ***, p < 0.001.

