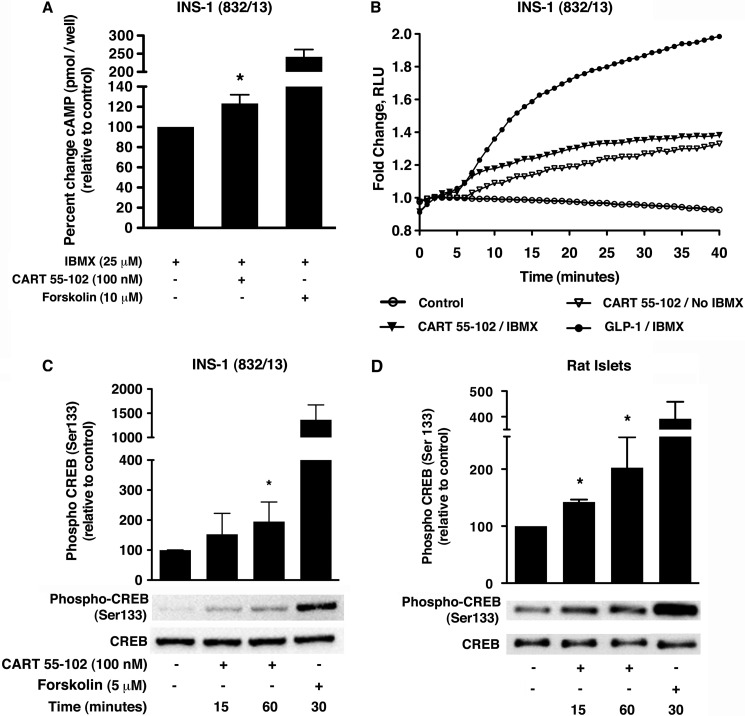
FIGURE 4.
CART 55–102 increases intracellular cAMP and induces phosphorylation of CREB at Ser-133 in INS-1 (832/13) cells and rat islets. A, the intracellular cAMP levels were assessed by EIA using 10 μm forskolin as positive control. The data are presented as mean ± S.D. of n = 3–4 independent experiments each performed in replicates of 3–4 wells per condition. The addition of 100 nm CART 55–102 elevated cAMP in the presence of IBMX, *, p ≤ 0.05 when compared with no CART control. B, kinetic response of the pGloSensorTM-22F biosensor variant after transient expression. 100 nm CART 55–102 elevated cAMP both in the presence and in the absence of IBMX. The data are shown as a representative trace from two experiments each performed in quadruplicates for each compound. RLU, relative light units. C and D, CART 55–102-mediated phosphorylation of CREB at Ser-133 in INS-1 (832/13) cells (C) exposed to glucotoxic conditions followed by 2 h of starvation in KRB-H buffer and in isolated rat islets (D). A representative immunoblot is shown with 5 μm forskolin as a positive control. The bar graph represents quantification of the relative levels of phospho-CREB to total CREB. The data are represented as mean ± S.D. (n = 3–6 experiments) with each condition performed in replicates (2–3) for INS-1 (832/13) and isolated rat islets. *, p ≤ 0.05, when compared with no CART control.

