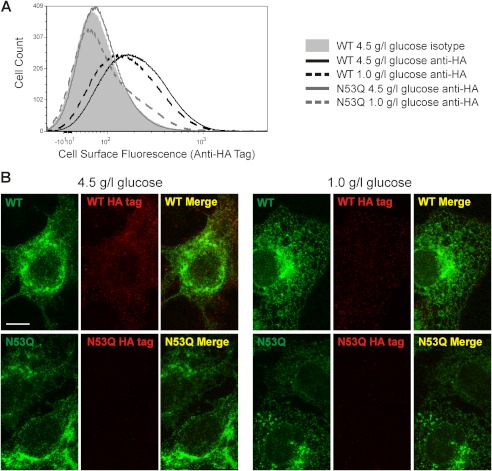
FIGURE 3.
Surface expression of rK2P3.1 responds to a reduction in the concentration of glucose in the culture medium. A, flow cytometric analysis of intact COS-7 cells expressing GFP-rK2P3.1-HA or GFP-rK2P3.1N53QHA. Cells were stained with either a monoclonal antibody against the external HA tag or an isotype control antibody, followed by goat anti-mouse F(ab′)2 fragment conjugated to Alexa Fluor 647. Solid gray curve, cells expressing GFP-rK2P3.1-HA, cultured in 4.5 g/liter glucose, stained with the isotype control; black solid line, GFP-rK2P3.1-HA, 4.5 g/liter glucose, anti-HA; black dashed line, GFP-rK2P3.1-HA, 1.0 g/liter glucose anti-HA; gray solid line: GFP-rK2P3.1N53QHA, 4.5 g/liter glucose, anti-HA; gray dashed line: GFP-rK2P3.1N53QHA, 1.0 g/liter glucose, anti-HA. B, confocal microscopic z-stack images of the COS-7 cells described in A, fixed and stained against HA tag (red). WT, GFP-rK2P3.1-HA; N53Q, GFP-rK2P3.1N53QHA (green fluorescence); Merge, superimposed images of total channel expression (green) and surface-exposed HA tag (red). The scale bar represents 10 μm.

