FIGURE 4.
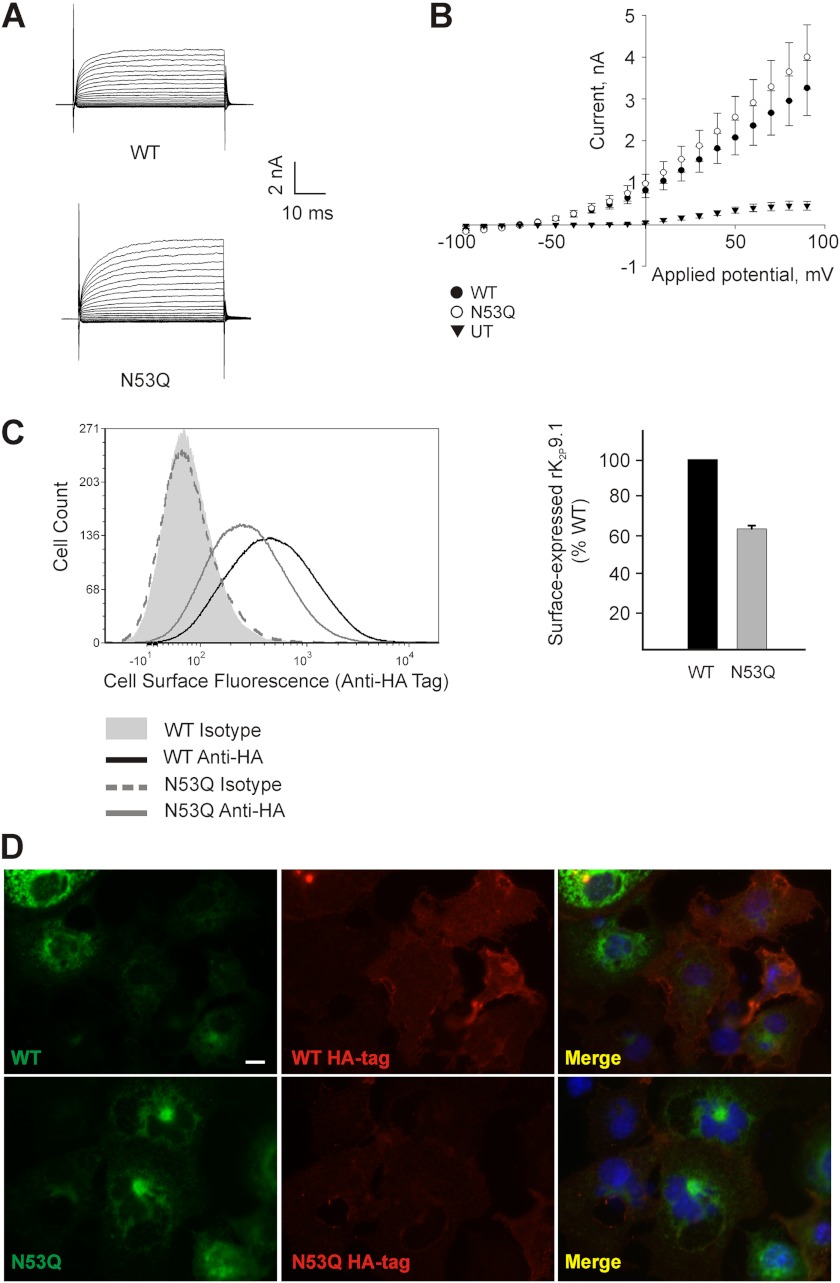
rK2P9.1 cell surface expression is less sensitive than rK2P3.1 to channel glycosylation state. A, currents evoked by applied membrane potential pulses from −100 to +90 mV in HEK293 cells expressing rK2P9.1 (WT) or rK2P9.1N53Q (N53Q) at pH 7.8. B, average current-voltage relationship for untransfected (UT) HEK293 cells, or HEK cells expressing rK2P9.1 (WT) or rK2P9.1N53Q (N53Q) at pH 7.8. C, flow cytometric analysis of intact COS-7 cells expressing GFP-rK2P9.1-HA (WT) or GFP-rK2P9.1N53QHA (HA). The cells were stained with either a monoclonal antibody against the external HA tag or an isotype control antibody, followed by goat anti-mouse F(ab′)2 fragment conjugated to Alexa Fluor 647. Solid gray curve, cells expressing GFP-rK2P9.1-HA, stained with the isotype control. Solid black line, cells expressing GFP-rK2P9.1-HA, stained with anti-HA tag antibody. Solid gray line, GFP-rK2P9.1N53QHA, anti-HA-tag. Dashed gray line, GFP-rK2P9.1N53QHA, isotype control. Bar chart, summary of three independent experiments to determine the surface expression of GFP-rK2P9.1N53QHA (N53Q) to GFP-rK2P9.1-HA (WT). The results are expressed relative to WT (100%). The error bar shows S.E. D, immunofluorescence images of the COS-7 cells described above, fixed and stained to detect external HA tag (red fluorescence). Upper panels, GFP-rK2P9.1-HA; lower panels, GFP-rK2P9.1N53QHA (green fluorescence). Merge, superimposed images of channel and HA tag fluorescence. The scale bar represents 10 μm.

