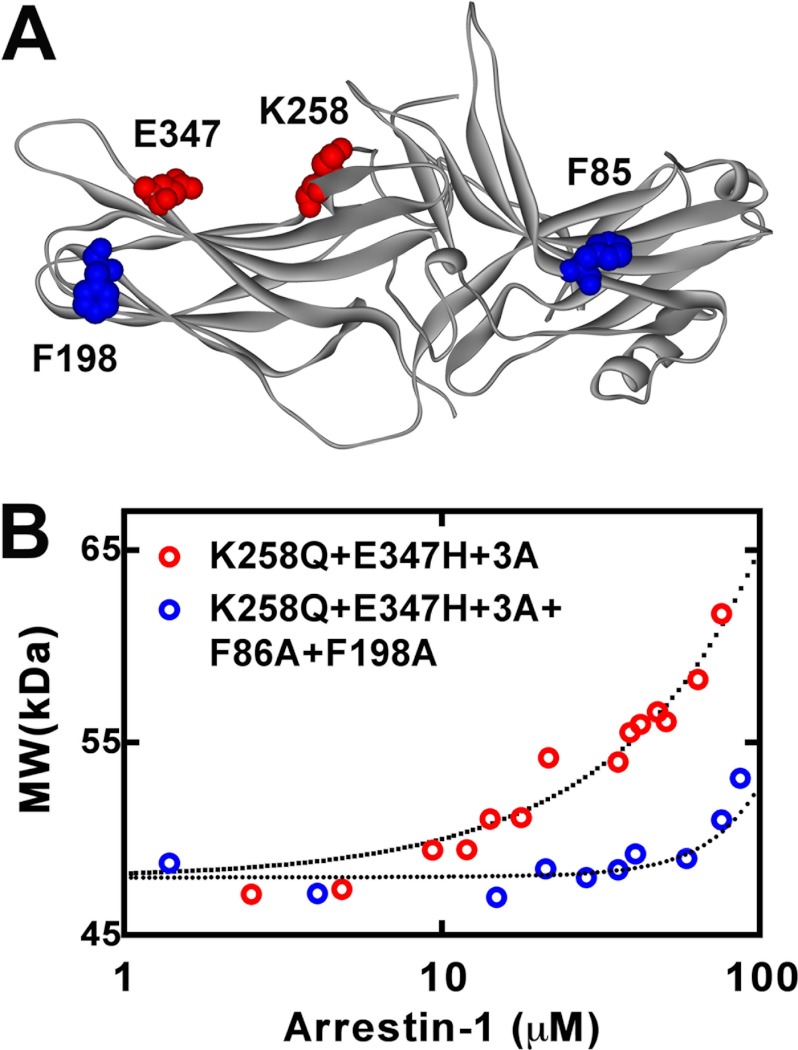
FIGURE 7.
Self-association of engineered mouse arrestin-1 mutants. A, the structural model of mouse arrestin-1 (based on bovine arrestin-1 crystal structure 1CF1 (37)) shows two residues mutated to enhance Rh* binding (Lys-258 and Glu-347) in red and two phenylalanines (Phe-86 and Phe-198) mutated to alanines to block self-association in blue. B, the average molecular weight of the K258Q/E347H+3A (red circles) and K258Q/E347H+3A+F86A/F198A (blue circles) mouse arrestin-1 mutants as a function of total arrestin-1 concentration was determined from the light scattering data (symbols). The fit of the data to the MDT model (dotted lines) was obtained as described (18). Note that K258Q/E347H+3A+F86A/F198A mutant showed no detectable tetramerization, so that the resulting fit describes monomer-dimer equilibrium.

