FIGURE 3.
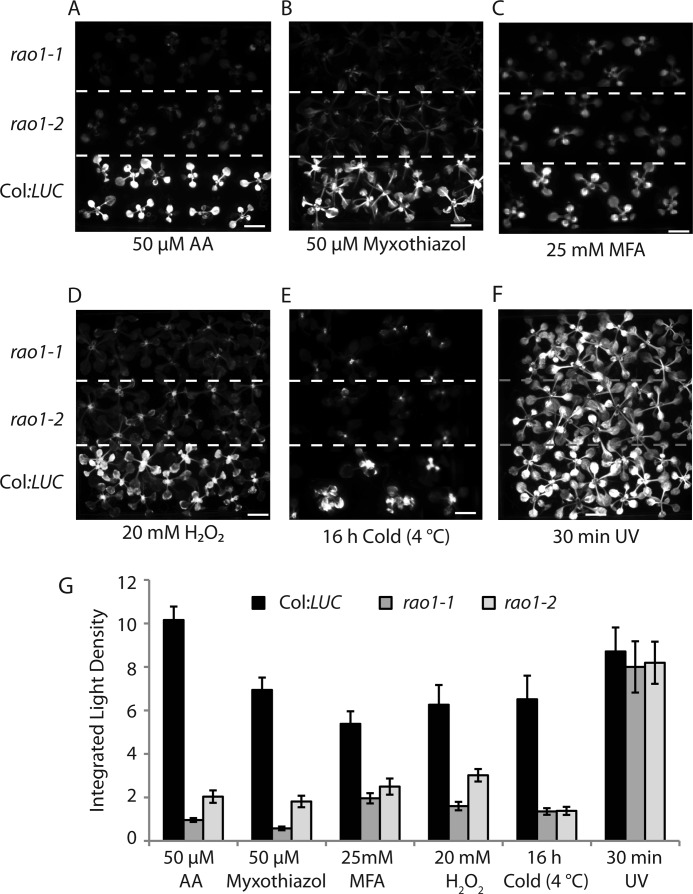
Characterization and quantification of AOX1a promoter inductions in rao1–1 and rao1–2 following different stress treatments. Col:LUC, rao1–1, and rao1–2 seedlings were treated with: A, 50 μm AA; B, 50 μm myxothiazol; C, 25 mm monofluoracetate (MFA); D, 20 mm H2O2; E, 16 h cold treatment (4 °C); F, 30 min ultraviolet (UV) light. Luciferase (LUC) reporter gene activity was visualized in a NightOwl bioluminescence imager after a 6-h treatment unless otherwise stated. Scale bars indicate 1 cm. G, processed images were analyzed for quantification of LUC expression using the Integrated Light Intensity from 8-bit images calculated in the Java software ImageJ. Error bars denote S.E. (n > 8 measurements).

