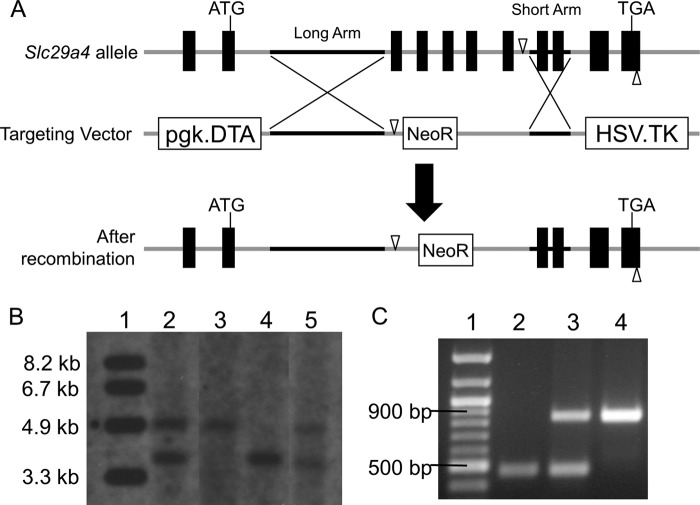
FIGURE 3.
A, schematic diagram showing Slc29a4 gene targeting strategy. The black boxes on the Slc29a4 allele indicate exons. The start and stop codons are noted. The genomic regions cloned into long and short arms are indicated with black lines. The open triangles represent StuI digestion sites used for Southern blot. B, Southern blot of genomic DNA digested with StuI to confirm homologous recombination. Lane 1, molecular mass marker; lane 2, ES cell clone used for blastocyst injection; lane 3, Pmat−/− mouse; lane 4, Pmat+/+ mouse; lane 5, Pmat+/− mouse. The expected band sizes are 3.5 kb for WT allele and 4.6 kb for Pmat null allele. C, PCR genotyping using genomic DNA from mice. Lane 1, molecular mass marker; lane 2, Pmat−/− mouse; 3, Pmat+/− mouse; lane 4, Pmat+/+ mouse. The expected band sizes are 847 bp for WT allele and 447 bp for Pmat null allele.

