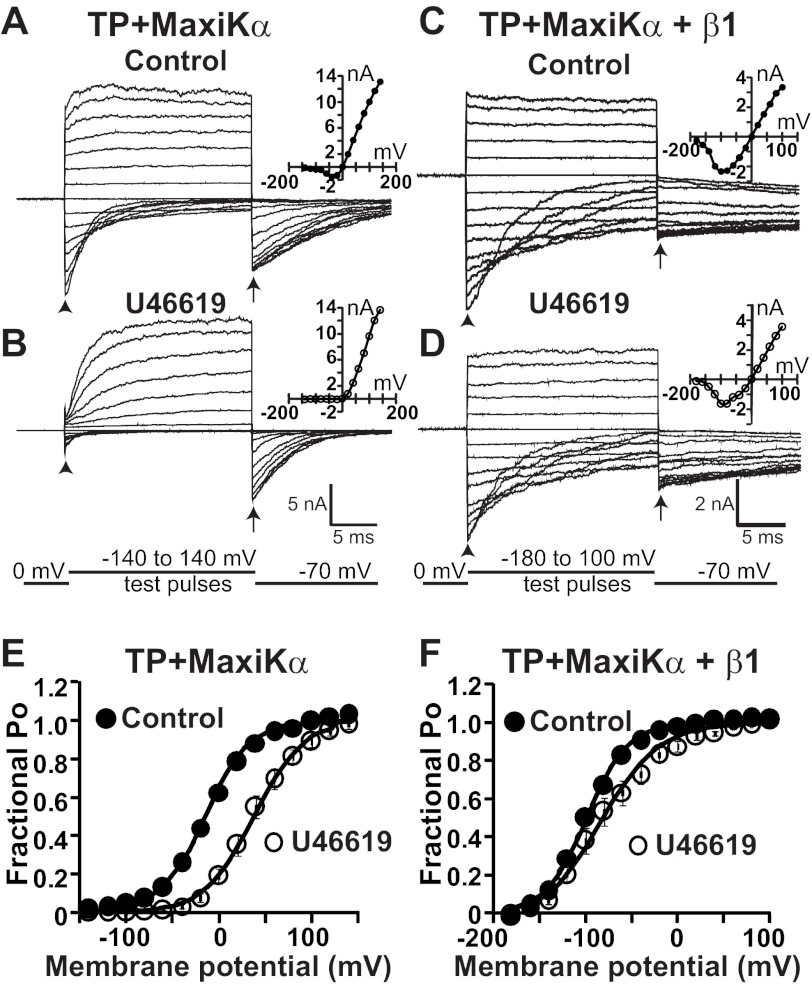
FIGURE 4.
β1 reduces TP-mediated positive shift in MaxiK channel voltage dependence of FPo. A and B, MaxiK currents from an inside-out HEK293T cell patch expressing TP and MaxiKα. Current traces are from the same patch upon excision (A; control) and after U46619 (500 nm) application (B). C and D, MaxiK currents from an inside-out patch of a cell coexpressing TP, MaxiKα, and β1. Current traces are from the same cell patch before (C; control) and after (D) 500 nm U46619 treatment. Insets in A–D are corresponding I-V curves. E, mean FPo versus membrane potential plot before (●; control) and after (○) 500 nm U46619 treatment from cells coexpressing TP and MaxiKα. As reported earlier, U46619 induced a rightward shift of the plot, consistent with significant MaxiK channel trans-inhibition (12). F, mean FPo versus membrane potential plot from cells coexpressing TP, MaxiKα, and β1. Data were fitted to Boltzmann distributions (continuous lines; see “Experimental Procedures”). U46619-containing solution was perfused to the bath (intracellular side of the patch), and its effect was recorded after 15 min of exposure. MaxiK currents were elicited by step depolarizations (test pulses) from −140 to 140 mV for A and B and from −180 to 100 mV for C and D. The repolarizing potential was −70 mV. The arrowheads mark tail currents elicited at the beginning of test pulses, and the arrows indicate the time point of instantaneous tail current measurements. [Ca2+]i was maintained constant at 6.7 μm. The holding potential was set at 0 mV. The TP-pIRES-c-Myc-MaxiKα plasmid was transfected at 0.6 or 0.9 μg, and β1 was at 1.6 μg, both in 1 ml of medium in a 35-mm dish.

