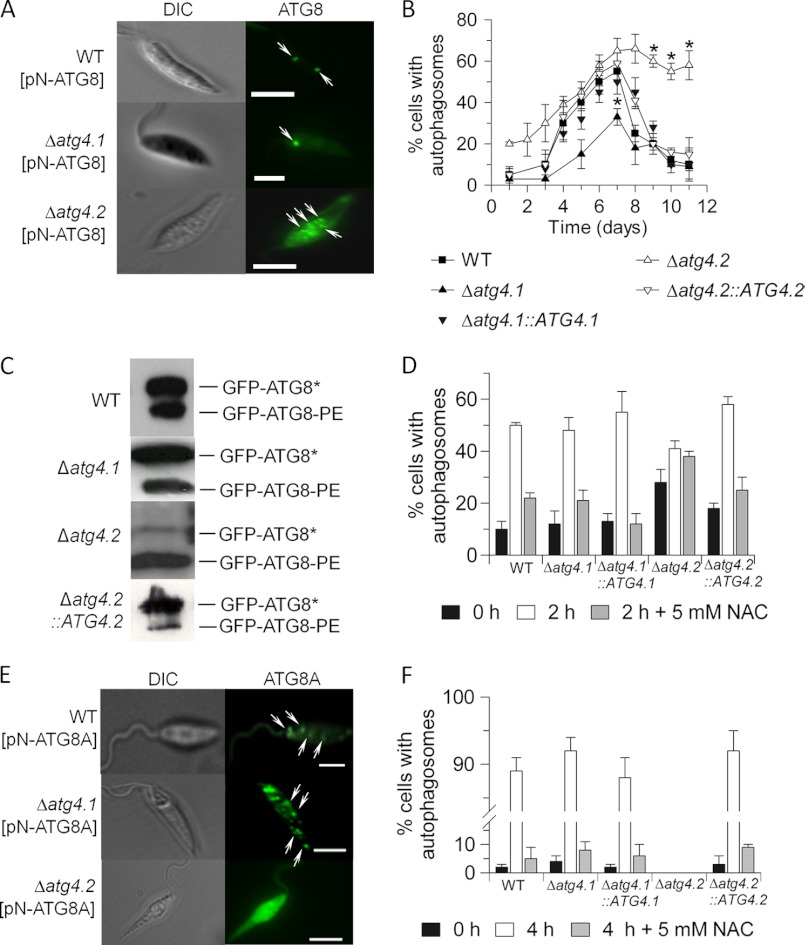
FIGURE 2.
Autophagosome formation in promastigotes of the Δatg4 mutants. A, occurrence of GFP-ATG8 puncta in L. major promastigotes in normal medium. The arrows indicate autophagosomes. Scale bar, 10 μm. B, the proportion of GFP-ATG8-expressing promastigotes with autophagosomes was assessed during growth in vitro. Data are mean ± S.D. from three independent experiments. Asterisks denote values statistically different from WT cells, p < 0.05. C, Western blot analysis of GFP-ATG8-PE. Promastigote cell extracts expressing GFP-ATG8 were separated by SDS-PAGE in the presence of 6 m urea and analyzed by Western blotting with an anti-GFP antibody. The faster migrating, lipidated bands are labeled GFP-ATG8-PE, whereas the un-lipidated bands migrating more slowly are labeled GFP-ATG8*. D, the occurrence of GFP-ATG8-labeled autophagosomes resulting from starvation of early log stage promastigotes in PBS for 2 h with or without added NAC. Data are mean ± S.D. from three independent experiments. E, occurrence of GFP-ATG8A puncta in starved L. major promastigotes. The arrows indicate autophagosomes. Scale bar, 10 μm. F, the occurrence of GFP-ATG8A-labeled autophagosomes resulting from starvation of early log stage promastigotes in PBS with or without added NAC. Note the discontinuity in the ordinate axis.

