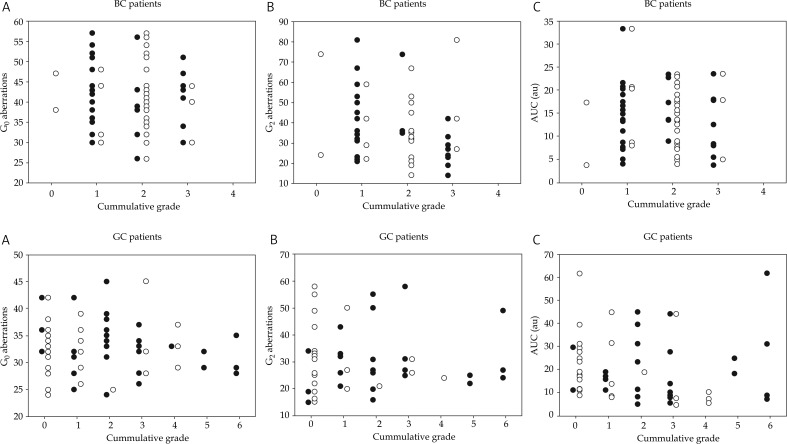
Fig. 4.
Relationships between radiation-induced aberration frequencies plus AUC values and early (black symbols) and late (open symbols) reactions to radiotherapy, expressed as cumulative grades. Top panels: breast cancer patients, bottom panels: gynaecological cancer patients. Panels A: G0 aberrations, panels B: G2 aberrations, panels C: AUC

