
Figure 2. Q-RT-PCR using TaqMan® (Life Technologies) for (A) heat shock protein 70 (Hsp70; Hspa1a) and (B) heat shock protein 40 (Hsp40; Dnajb1) performed on whole liver samples from Sham (n = 6), trauma with hemorrhagic shock (T/HS, n = 4), and T/HS animals resuscitated with IL-6 (T/HS-IL6, n = 4).
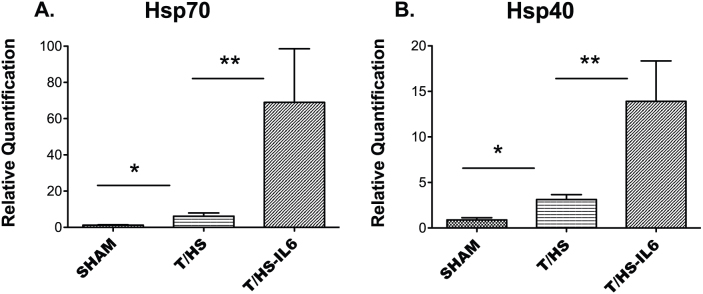
Transcript values reported as relative quantification (RQ) in comparison to a normal rat liver. Values expressed as mean RQ ± SEM. “*”, “**” indicate group comparisons which are statistically different (p < 0.05) by T-test.