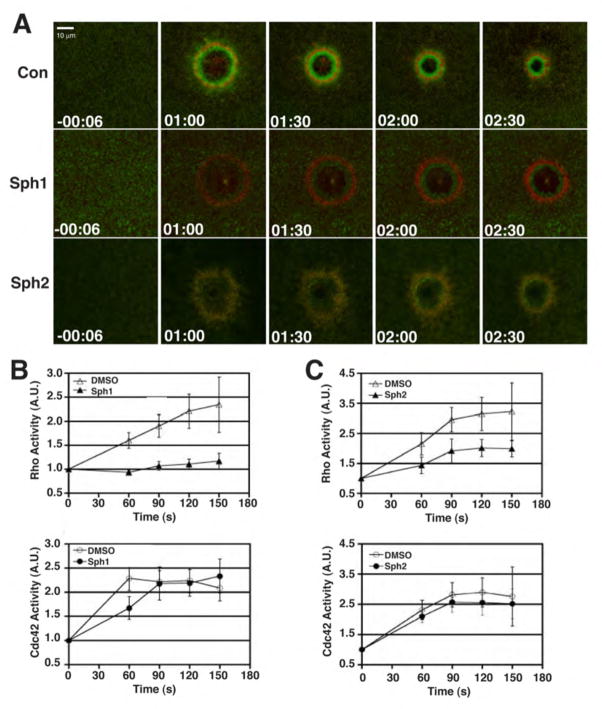
Figure 3. Sph1 and Sph2 reduce wound-induced Rho activation.
A. Fluorescent images from 4D movie series showing distribution of active Rho (green) and active Cdc42 (red) at increasing times after wounding. Time in min:sec; negative number indicates time prior to wounding. B. Quantification of Rho (top panel) and Cdc42 (bottom panel) activity in presence of DMSO or Sph1. Values represent average intensity of fluorescence signal in the zone surrounding the wound divided by average intensity of signal prior to wounding (t = −00:06). Results presented as mean ± S.D.; n > 6. C. Quantification of Rho (top panel) and Cdc42 (bottom panel) activity in presence of DMSO or Sph2. Values represent average intensity of fluorescence signal in the zone surrounding the wound divided by average intensity of signal prior to wounding (t = −00:06). Results presented as mean ± S.D.; n ≥ 6.

