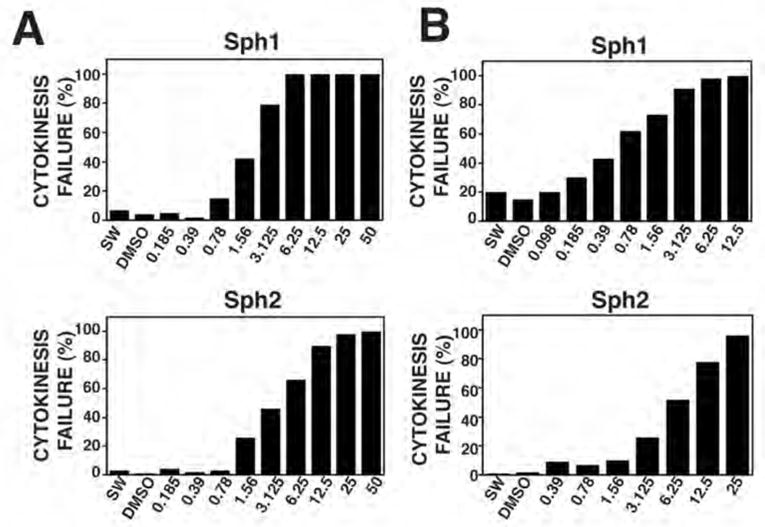
Figure 4. Sand dollar cytokinesis is inhibited by submicromolar concentrations of Sph1 and Sph2.

A. Dose response analysis of healing at 14°C in sea water (SW) or sea water containing DMSO (0.2%) or indicated concentrations (in μM) of Sph1 (top panel) or Sph2 (bottom panel). B. Dose response analysis of cytokinesis at RT in sea sater (SW) or sea water containing DMSO (0.2%) or indicated concentrations (in μM) of Sph1 (top panel) or Sph2 (bottom panel). n ≥ 80 for each concentration tested.
