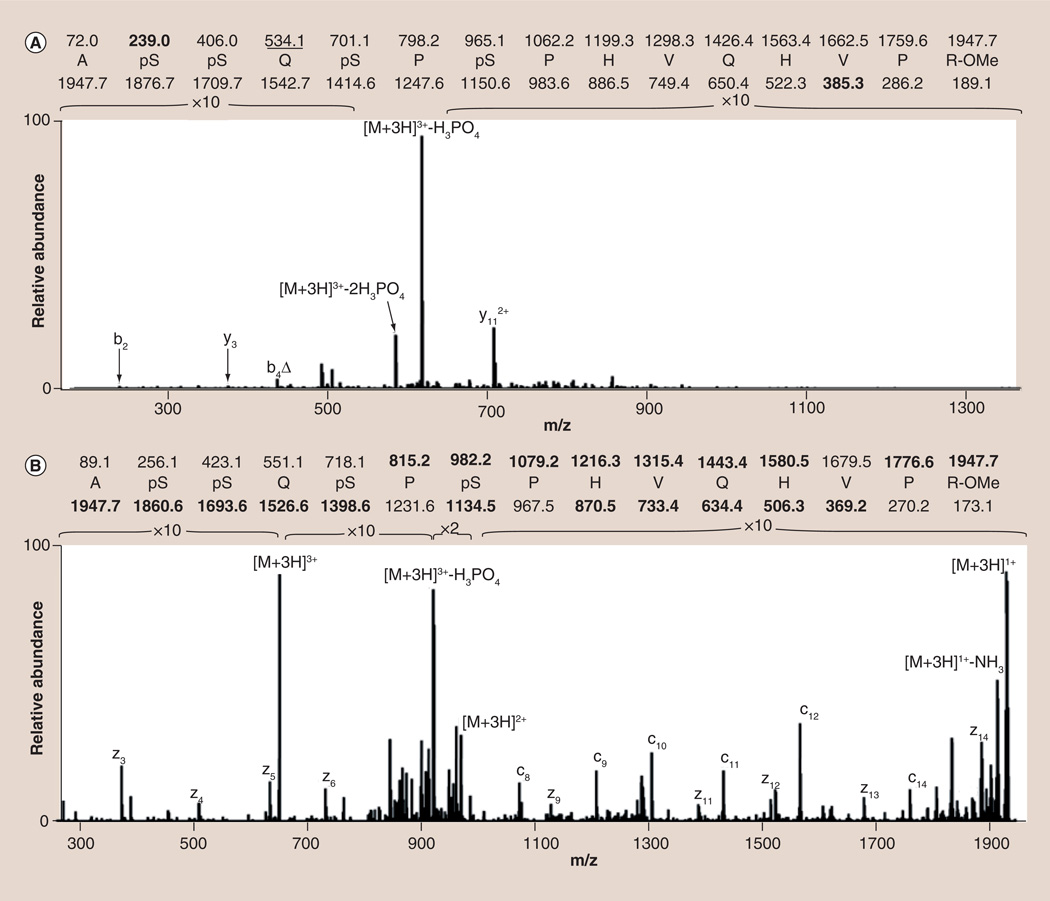
Figure 3. Comparison between the (A) CID and (B) ETD spectra of a +3, quadruply phosphorylated peptide from testis-specific serine/proline-rich protein.
While the CID spectrum is dominated by the neutral loss of phosphoric acid from the intact precursor, the ETD spectrum shows significant, sequence-informative peptide backbone fragmentation. Calculated m/z values found in the spectra are shown in bold while those m/z values exhibiting the neutral loss of phosphoric acid are underlined. Δ denotes assigned sequence ions which have undergone the neutral loss of phosphoric acid.
CID: Collisionally induced dissociation; ETD: Electron transfer dissociation.

