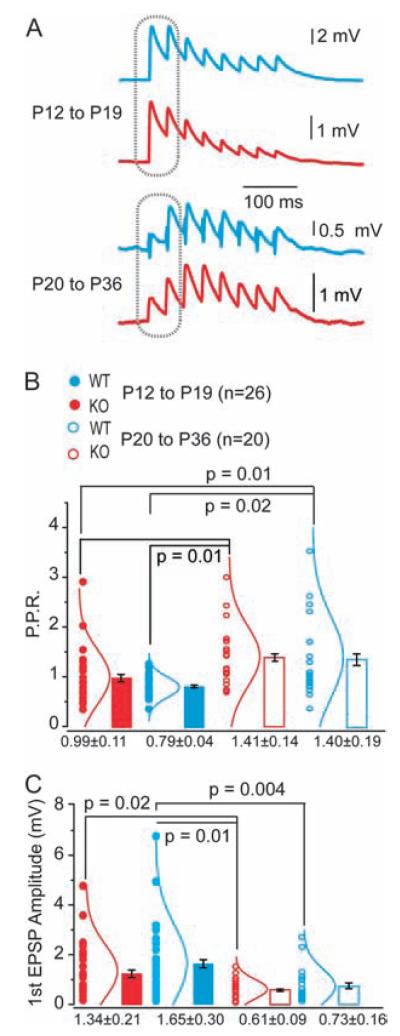
Figure 2.
Synaptic maturation and dynamics of WT and Fmr1-KO connections during development. (A) Example EPSP traces of typical responses to AP trains in WT (blue) or KO neurons (red) at P12–19 (above) and P20–36 (below). (B) Paired-pulse ratios, measured at responses indicated on traces in A, are significantly increased in the older age groups for both WT and KO. *P values indicated, Fisher’s analysis of variance (ANOVA). No significant difference exists between WT and KO at either age group. Mean ± SEM shown. Individual data points (circles) and the corresponding normal distribution curves shown by each bar. (C) Amplitude of first EPSP in evoked train is significantly reduced in older age groups (P20–36) compared with younger (P12–19) for both WT and KO neurons. *P values indicated, Fisher’s ANOVA. Mean ± SEM shown. Individual data points (circles) and the corresponding normal distribution curves shown by each bar.

