Figure 3.
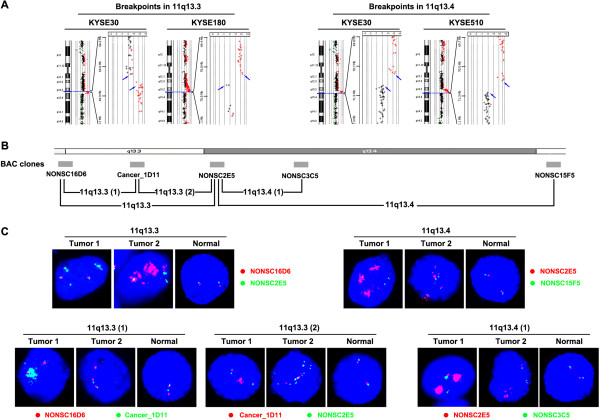
11q13.3 and 11q13.4 are recurrent breakpoint regions in both the ESCC cell lines and primary tumors. (A) Breakpoints in 11q13.3 and 11q13.4 in the cell lines detected by array-CGH. Breakpoints fall between the probes that displayed significant copy number discrepancies (blue arrows). Amplifications are indicated with red signals. (B) The 1-Mb BAC clones that are used in dual-color FISH experiments are shown in the ideogram. Also, 11q13.3 and 11q13.4 are divided into smaller regions according to the positions of BAC DNA clones: 11q13.3(1) (from NONSC16D6 to Cancer_1D11), 11q13.3(2) (from Cancer_1D11 to NONSC2E5) and 11q13.4(1) (from NONSC2E5 to NONSC3C5). (C) Detection of 11q13.3-q13.4 breakpoint regions by dual-color FISH in ESCC tumors. BAC DNA probes at two sides of the breakpoint regions are labeled with Cy3-dUTP (red) and Green-dUTP (green). The BAC clones used for each region are listed beside the panel. Two examples of positive tumors are shown for each region. “Tumor 1” and “Tumor 2” samples shown for different regions may not be from the same cases. Most splitting-positive nuclei exhibited amplifications on one side, even high-level amplifications, revealing the breakages between red and green signals. Normal: peripheral blood from normal persons.

