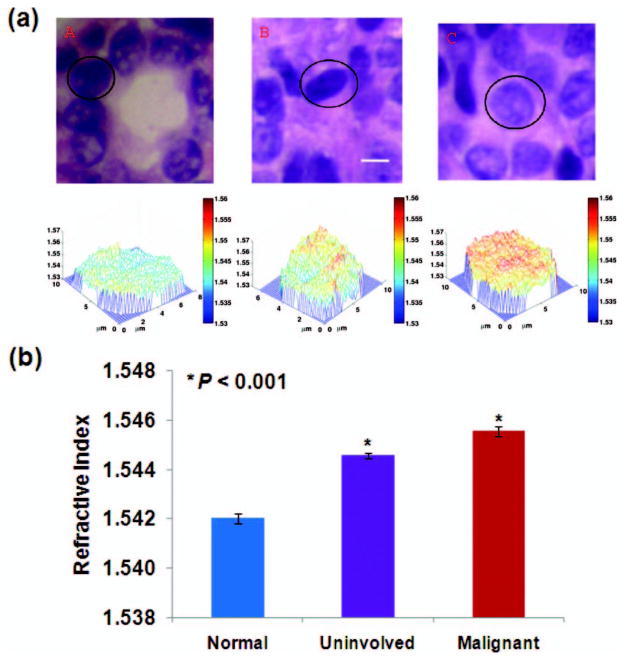
Fig. 3.
(a) Representative histology images and the corresponding refractive index maps of cell nuclei from (a) normal, (b) uninvolved, and (c) malignant cells. The scale bar indicates 5 μm. (b) By analyzing approximately 30 cell nuclei per group, the average refractive indices of malignant and uninvolved cell nuclei are significantly increased when compared to the normal cell nuclei (t-test, two-sided P value <0.001).

