
Figure 3.
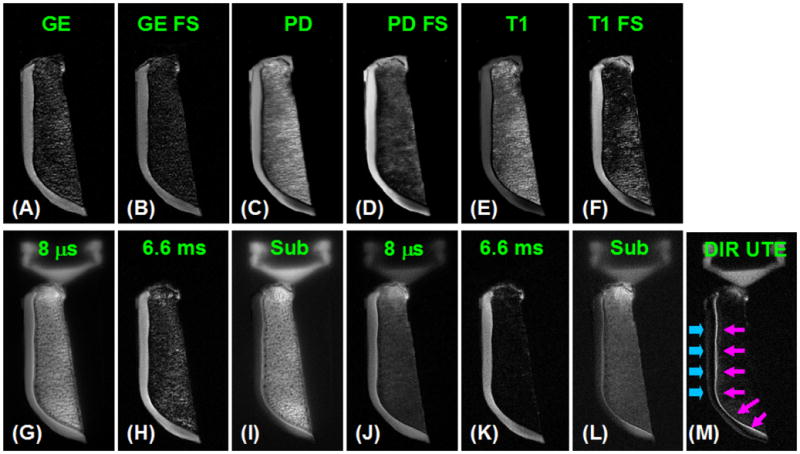
Axial imaging of a patella slice with clinical gradient echo (A), GE with fat saturation (B), PD FSE (C), PD FSE with FS (D), T1 FSE (E), T1 FSE with FS (F), conventional UTE with a TE of 8 μs (G) and 6.6 ms (H), subtraction of the second echo from the first echo (I), fat saturated UTE with a TE of 8 μs (J) and 6.6 ms (K) with the corresponding later echo subtraction (L), and DIR UTE (M). Clinical gradient echo or spin echo sequences show no signal from the calcified cartilage, which appears bright with UTE sequences but there is limited contrast between the deep layers of cartilage and superficial layers of cartilage as well as with bone marrow fat. The DIR UTE image shows the calcified cartilage with excellent contrast (pink arrows) with good suppression of the superficial layers of cartilage and fat. There is some signal from the superficial layer of cartilage due to variation in T1.