Figure 1.

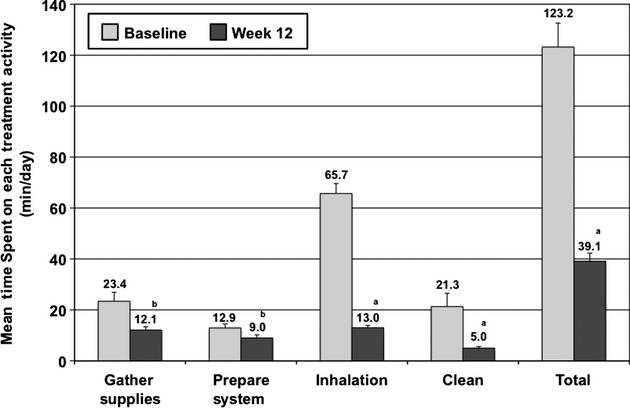
Time spent on daily treatment activities. The mean (±SE) time spent on each activity (min/day) is presented for baseline (iloprost; n = 70) and week 12 (inhaled treprostinil; n = 61). aP < 0.001; bP < 0.01.

Time spent on daily treatment activities. The mean (±SE) time spent on each activity (min/day) is presented for baseline (iloprost; n = 70) and week 12 (inhaled treprostinil; n = 61). aP < 0.001; bP < 0.01.