Figure 6.

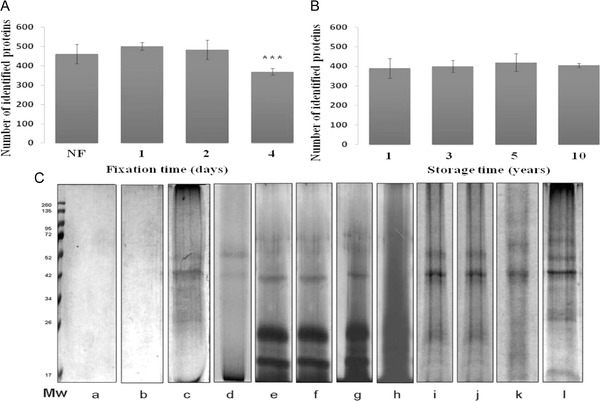
Assessment of FFPE sample fixation time, storage time, and extraction buffer variability on protein identification and yield by shotgun LC-MS/MS. (A) Effect of fixation time on the number of identified proteins. (B) Effect of storage time on the number of identified proteins. Error bars represent SD, (n = 9) for both (A) and (B). *** indicates significant different from all groups (p<0.001). (C) Electrophoretic pattern of 20-μg FFPE mouse heart tissue extracted with different extraction buffers and stained with Coomassie. (a) Tris buffer containing 1% β-octylglucoside; (b) 2% CHAPS; (c) Laemmli buffer containing 2% SDS; (d) RIPA buffer containing 2% SDS and 1% NP40; (e, h) acidic Tris buffer containing glycine and 2% SDS (e) or 0.2% Tween 20 (h); (f, g) neutral Tris buffer containing glycine, 2% SDS, and 1% NP40 (f) or 0.2% Tween 20 (g); (i, j) basic Tris buffer containing 2% SDS, 0.2% Tween 20, glycine, with DTT (i) or without DTT (j); (k) commercially FFPE extraction buffer (Qproteome FFPE tissue kit, Qiagen, Germany); (l) basic Tris buffer containing 2% SDS, 1% ß-octylglucoside, DTT, and glycine (reproduced with permission from Refs. [13] and [17]).
