
Figure 4.
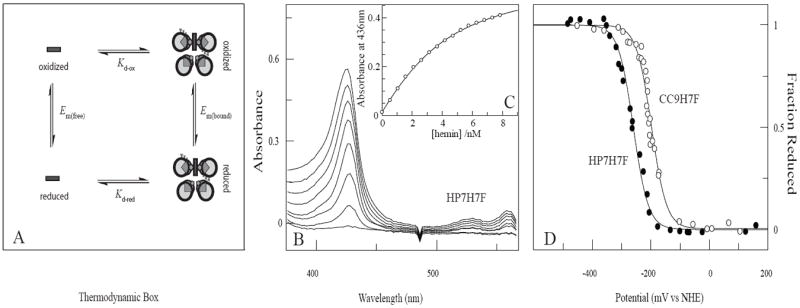
Thermodynamic cycle analysis of oxidized heme affinity. (A) The thermodynamic box used to determine Kd,ox. (B) Spectrometric titration of reduced heme binding to 3.0 μM HP7-H7F in 250mM Boric Acid, 100mM KCl pH 9.0. Some spectra have been omitted for clarity. (C) Equilibrium binding isotherm derived from the titration in (B). The line drawn is a fit with Eqn. 4 using a Kd,red of 600 nM. (D) Equilibrium potentiometric determination of the electron affinities HP7-H7F and CC9-H7F. Lines drawn are fits with Eqn. 1.