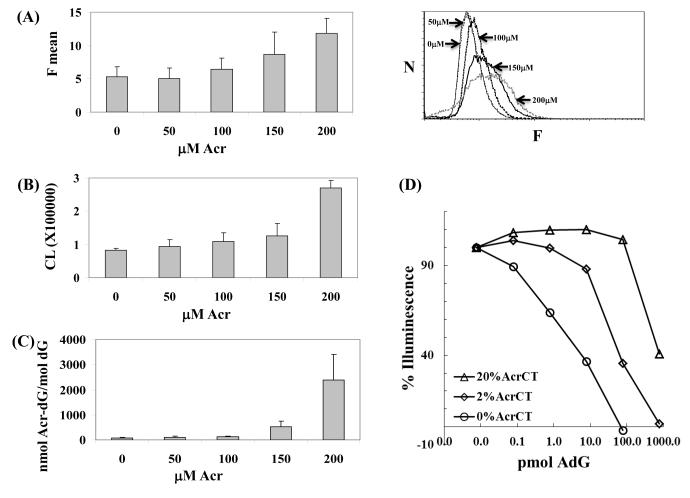
Figure 4. Acr-dG levels in HT29 cells measured with A3-mAb4 by FACS analysis, sensitive ELISA assay and LC-MS/MS-MRM.
(A) In the FACS assay, the left panel shows that the average fluorescence intensity (F mean) indicates the antibodies bound in a concentration-dependent manner to the cellular DNA containing Acr-dG. The right panel shows the original histograms with X-axis as the fluorescence (F) and Y axis as the number of cells (N). The p values from t-test for 0 vs 50, 50 vs 100, 100 vs 150 and 150 vs 200 μM comparisons are 0.4, 0.14, 0.14 and 0.08, respectively. (B) A highly sensitive ELISA assay shows the Acr-dG levels in DNA extracted from HT29 cells. Only one μg DNA from each sample was used, and the chemiluminescence signal (CL), representing the binding of antibodies to DNA, showed that the Acr-dG levels increased in a concentration-dependent manner. The corresponding p values as (A) are 0.26, 0.3, 0.3 and 0.02, respectively. (C) To validate this, Acr-dG levels in the same DNA samples were quantified with by LC-MS/MS-MRM. The corresponding p values as (A) are 0.2, 0.3, 0.08 and 0.06, respectively. All results were obtained from duplicate experiments. (D) Quantification of Acr-dG by a competitive ELISA assay. To the ELISA plates were coated with different levels of modified CTDNA, different amount of Acr-dG standards were added together with the anti-Acr-dG antibodies. The approximate detection ranges that can be used to quantify the Acr-dG adducts are: 100pmol to more than 1000pmol for the 20% Acr-CTDNA coated plates, 10pmol to 1000pmol for the 2% Acr-CTDNA coated plates and <100fmol to 100pmol for and the un-modified CTDNA coated plates.

