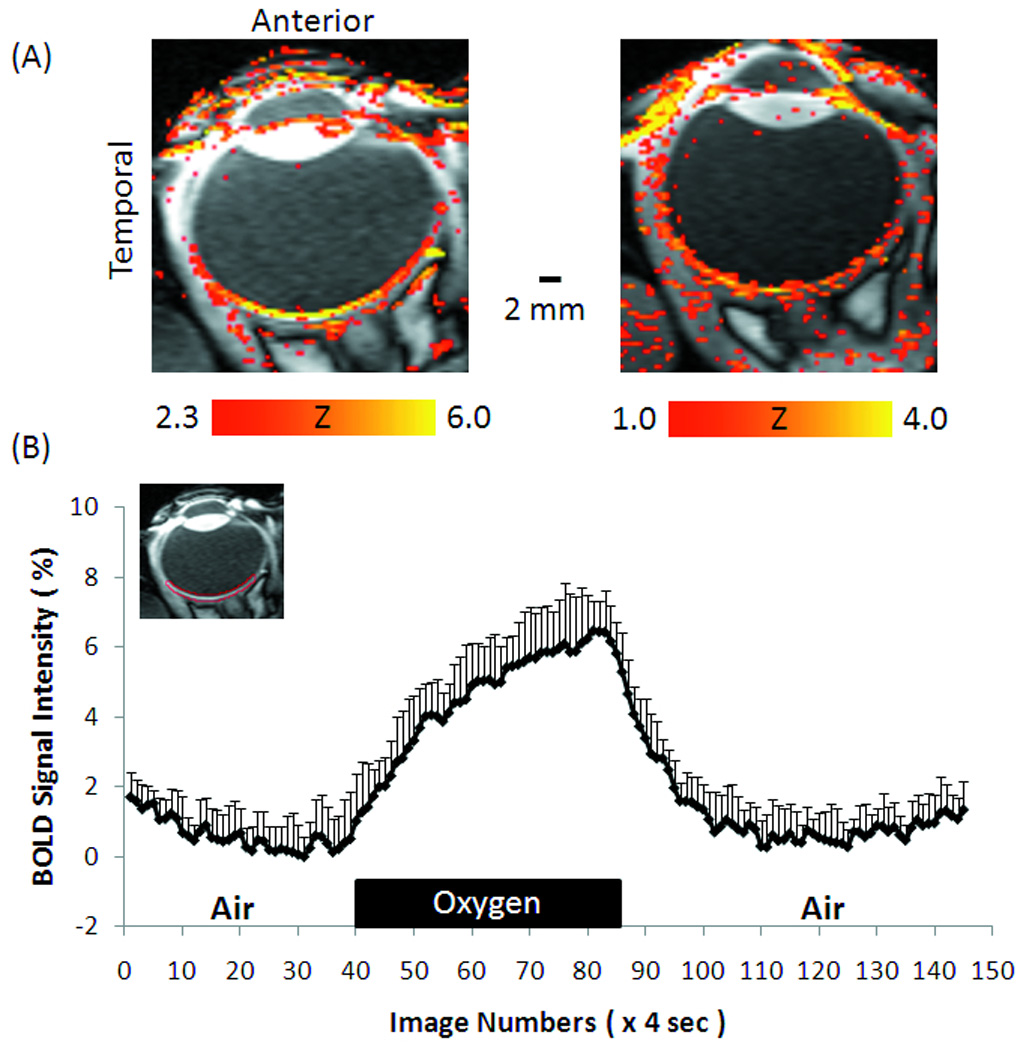
Figure 5.

(A) BOLD fMRI at 0.3×0.6×2 mm of oxygen versus air inhalation from two subjects, and (B) the group-averaged time course of oxygen versus air inhalation. Inset image: ROI used to obtain the group-averaged time course. Error bars are standard deviations across trials. Note that scattered activations in the ciliary bodies and extraocular tissue are also expected as oxygen inhalation causes global BOLD increases.
