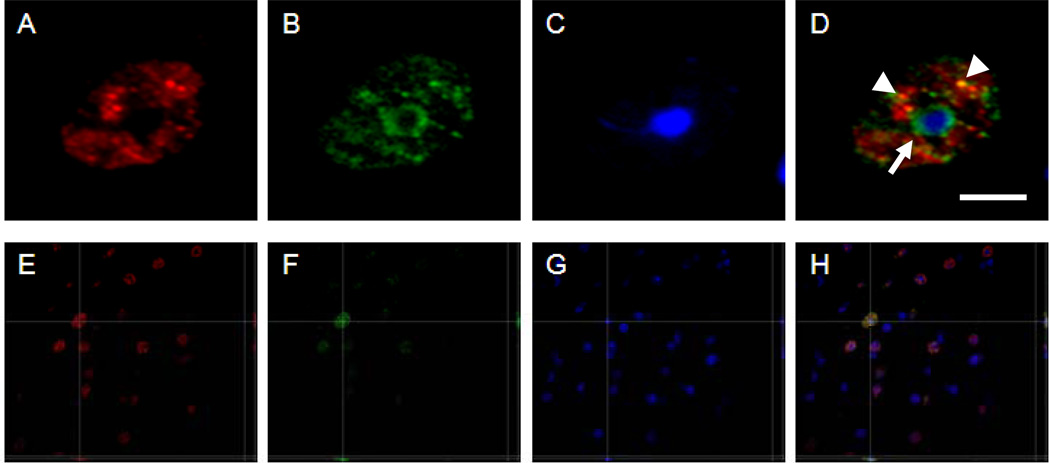
Figure 2.
5-hmC and 5-mC immunofluorescence, and DAPI labeling. Representative high magnification images of a nucleus of a cell in a 12-month-old mouse showing fluorescence labeling of 5-hmC (red) (A and E), 5-methylcytidine (5-mC) (green) in B and F, and DAPI (blue) in C and G, at the corresponding location and focal plane, with merged pictures in D and H. All images represent one stack taken with the SI-SD system (see text for more details). Note the single white arrow indicates the colocalization between 5-mC (green) and DAPI (blue) in heterochromatin, and the arrowheads indicate the colocalization between 5-hmC and 5-mC. Images E-H show a three-dimensional reconstruction of a representative image stack. The crossing lines indicate the position within the X-Y view at which the Y-Z and X-Z views were generated. Scale bar = 5 µm in A-D and 30 µm in E-H.

